Ozone
Debugger and performance analyzer
- Full-featured graphical debugger for Arm and RISC-V embedded applications
- Source-level debugging for C, C++, and Rust with support for most toolchains and IDEs
- Integrated performance analysis tools, including instruction trace, code profiling, and code coverage

Key features
Advanced debugging
Ozone is an intuitive full-featured graphical debugger. It provides all common debug tools, such as a source window, memory and register windows, execution control, and more. In addition, it also adds numerous tools for validation, advanced debugging, and performance analysis.
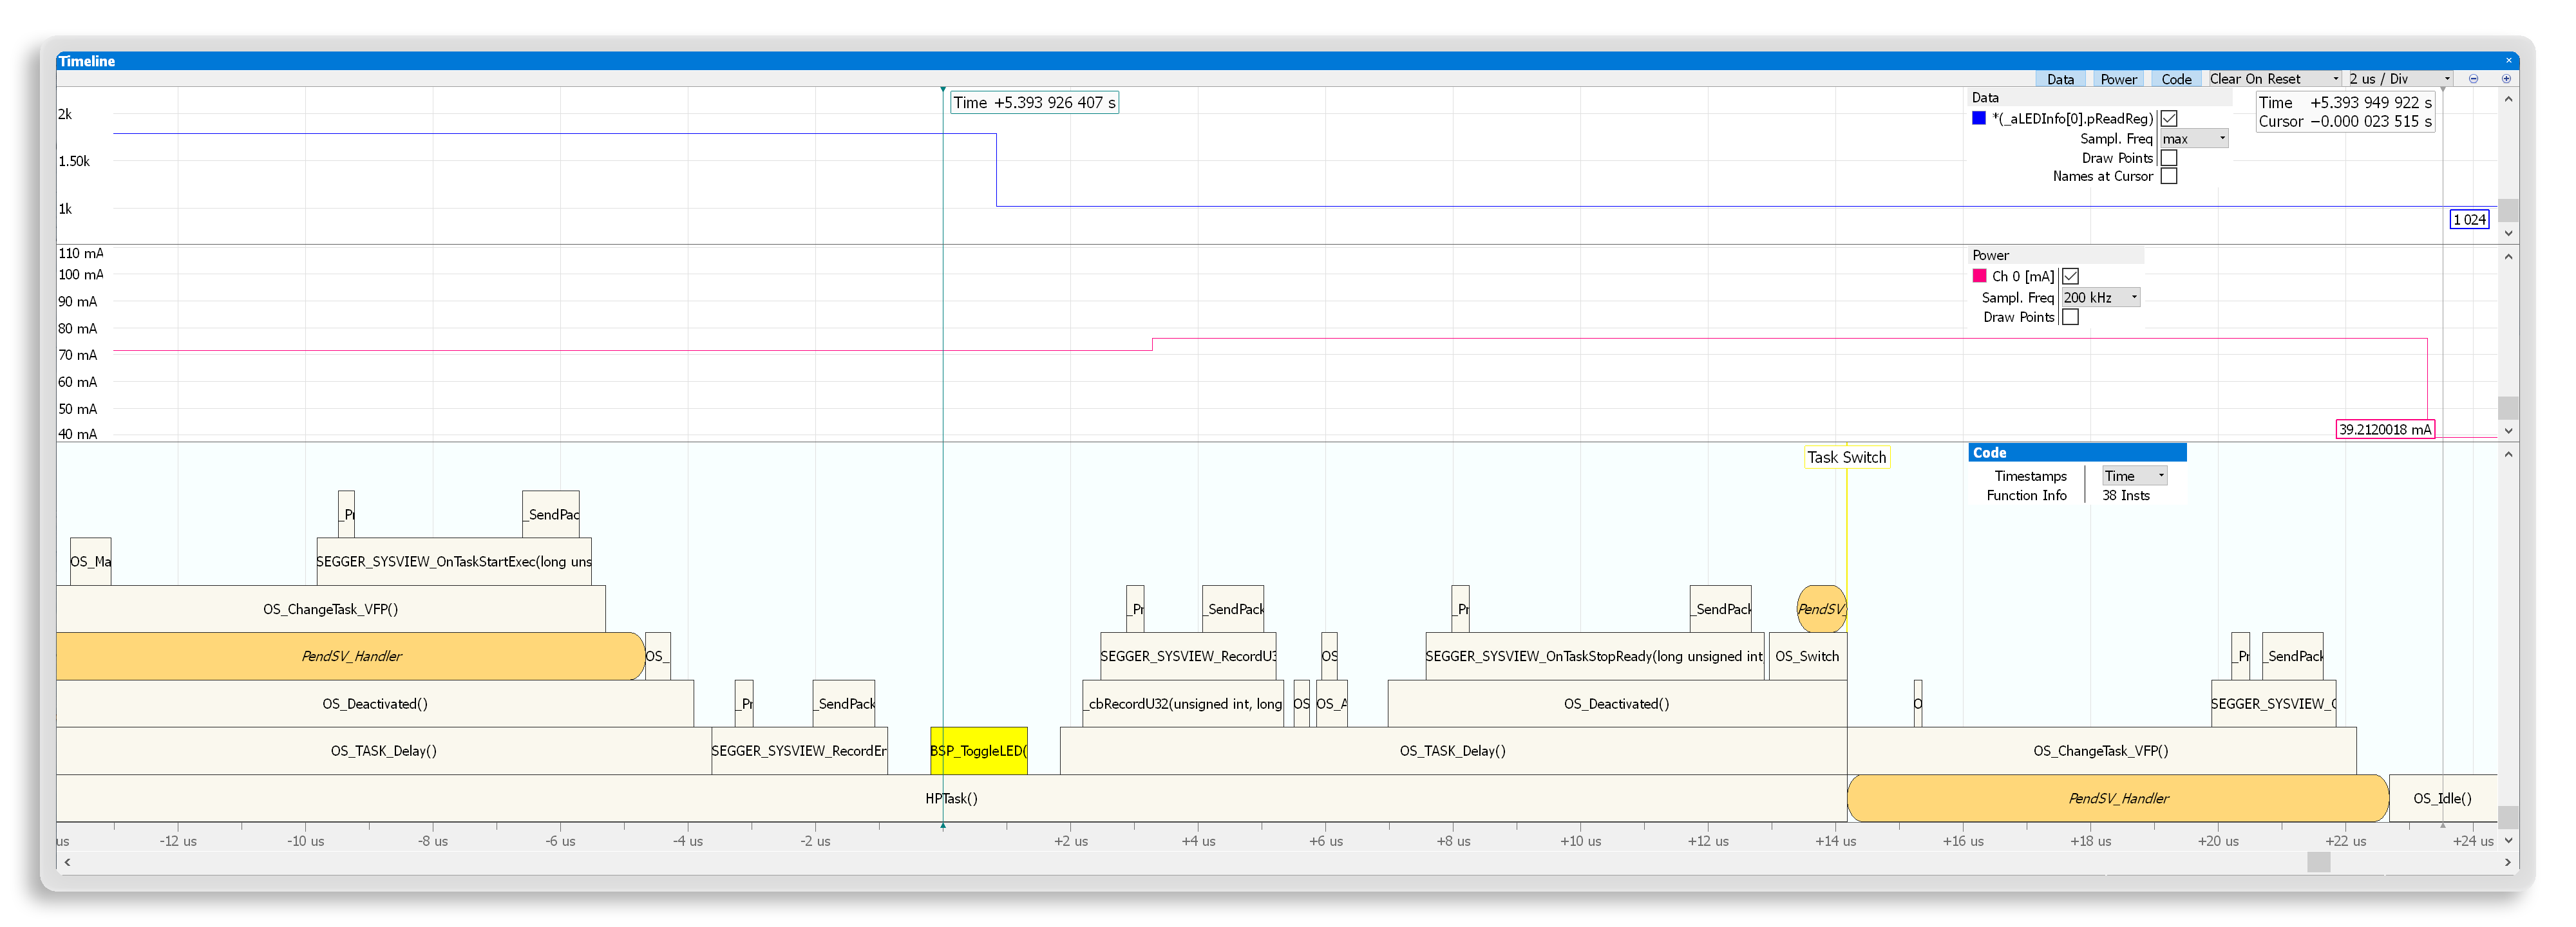
Performance analysis
Ozone turns raw trace data into actionable insights. Visual timelines, code profiling, and coverage reports help identify bottlenecks, optimize execution paths, and validate test completeness — ensuring highly reliable systems.
Testing and automation
The automation interface grants full access to the console window, allowing a user to issue commands and monitor output. Anything that can be done in a manual debug session can also be done via the automation interface in an automated environment.
Maximum flexibility
Ozone supports any toolchain, including Embedded Studio, GCC-based IDEs, Clang/LLVM, IAR, the Arm Compiler, and others. This ensures maximum flexibility, as applications can be loaded from a user's preferred build environment or debugged directly on a device with no need to rebuild.
How Ozone works
Using Ozone starts with creating firmware with a toolchain of the user's choice. Once Ozone is started, the user selects a firmware image and a target microcontroller or microprocessor in order to start debugging immediately. Ozone establishes a connection with a debug probe and provides full control over the target system. When changes are made to the firmware image, a running Ozone instance detects the update and suggests using the modified image.
Users who want to quickly verify a simple code change can also use the built-in source editor to apply an immediate bug fix or perform a quick test.
While Ozone performs best with J-Link and J-Trace debug and trace probes, it is also available for use with third-party probes and simulators.
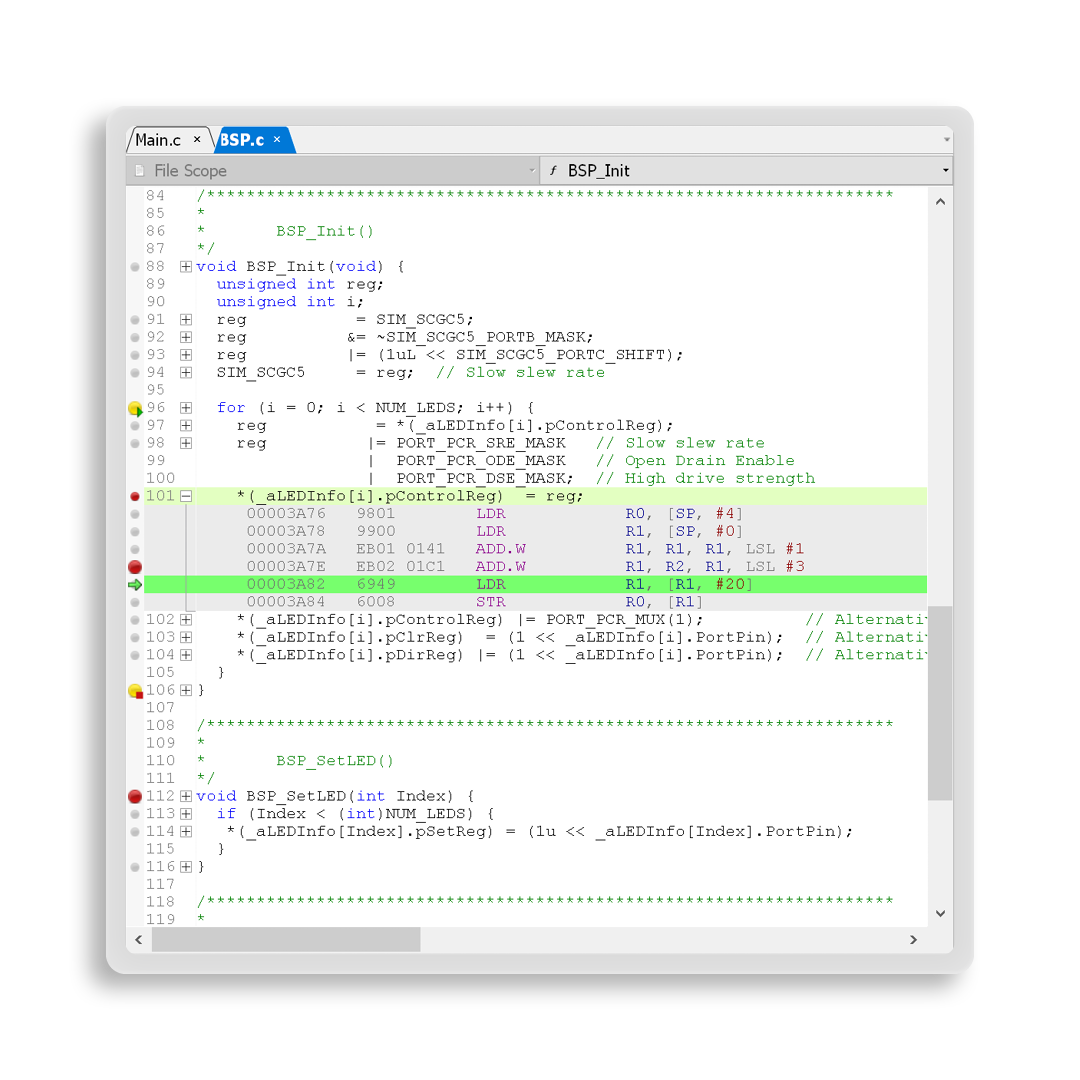
Efficient debugging
Ozone provides developers with all of the features commonly found in modern debuggers. These include a full-fledged source-code window, syntax highlighting, symbol and data windows, and register and memory displays. Ozone goes beyond typical debugging use cases to enable efficient and extensive debugging within a fully integrated user interface.
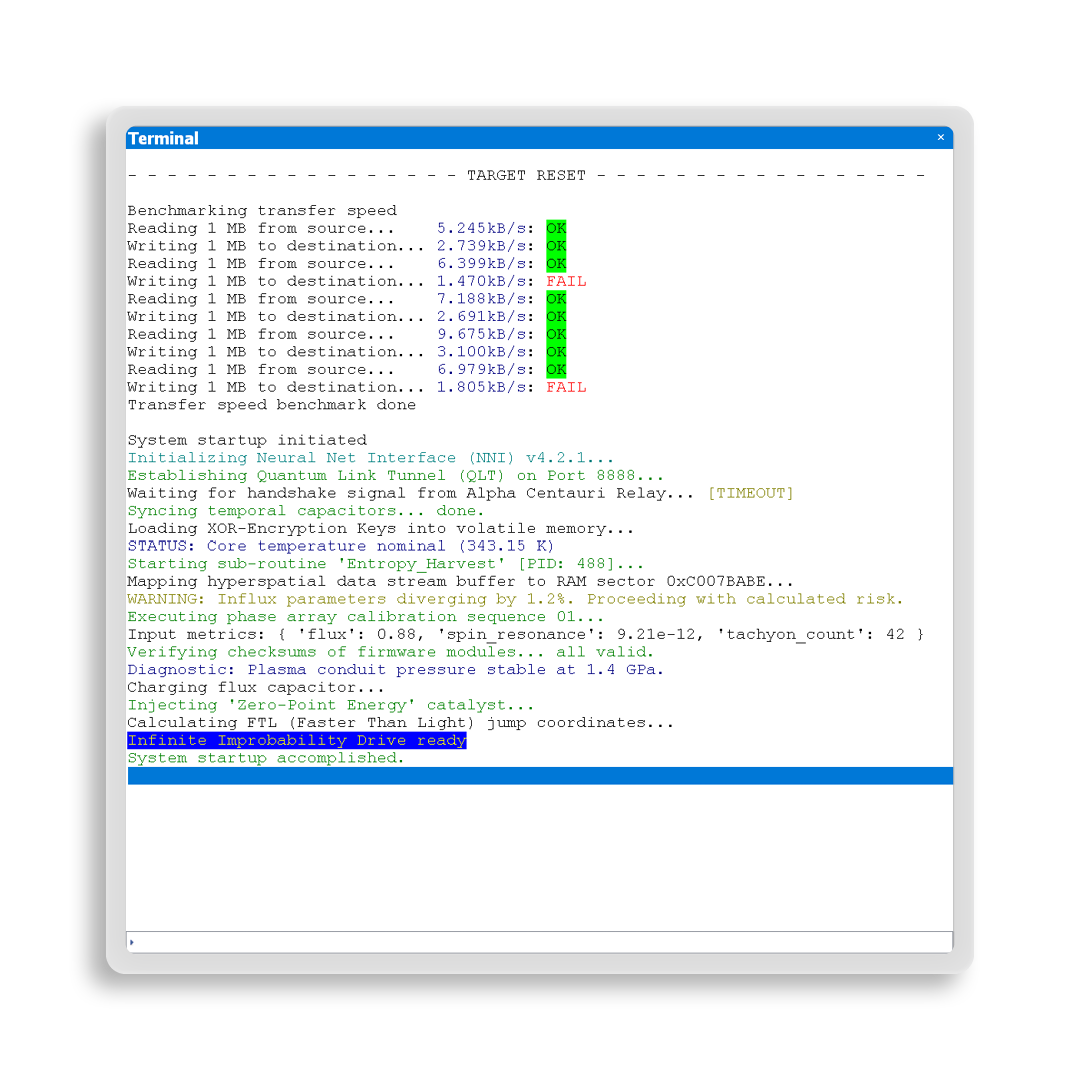
Target control and communication
Ozone provides full control over the target via the debug interface, which means users can step through code, utilize breakpoints, and more. Additionally, Ozone enables device communication and logging of firmware output.
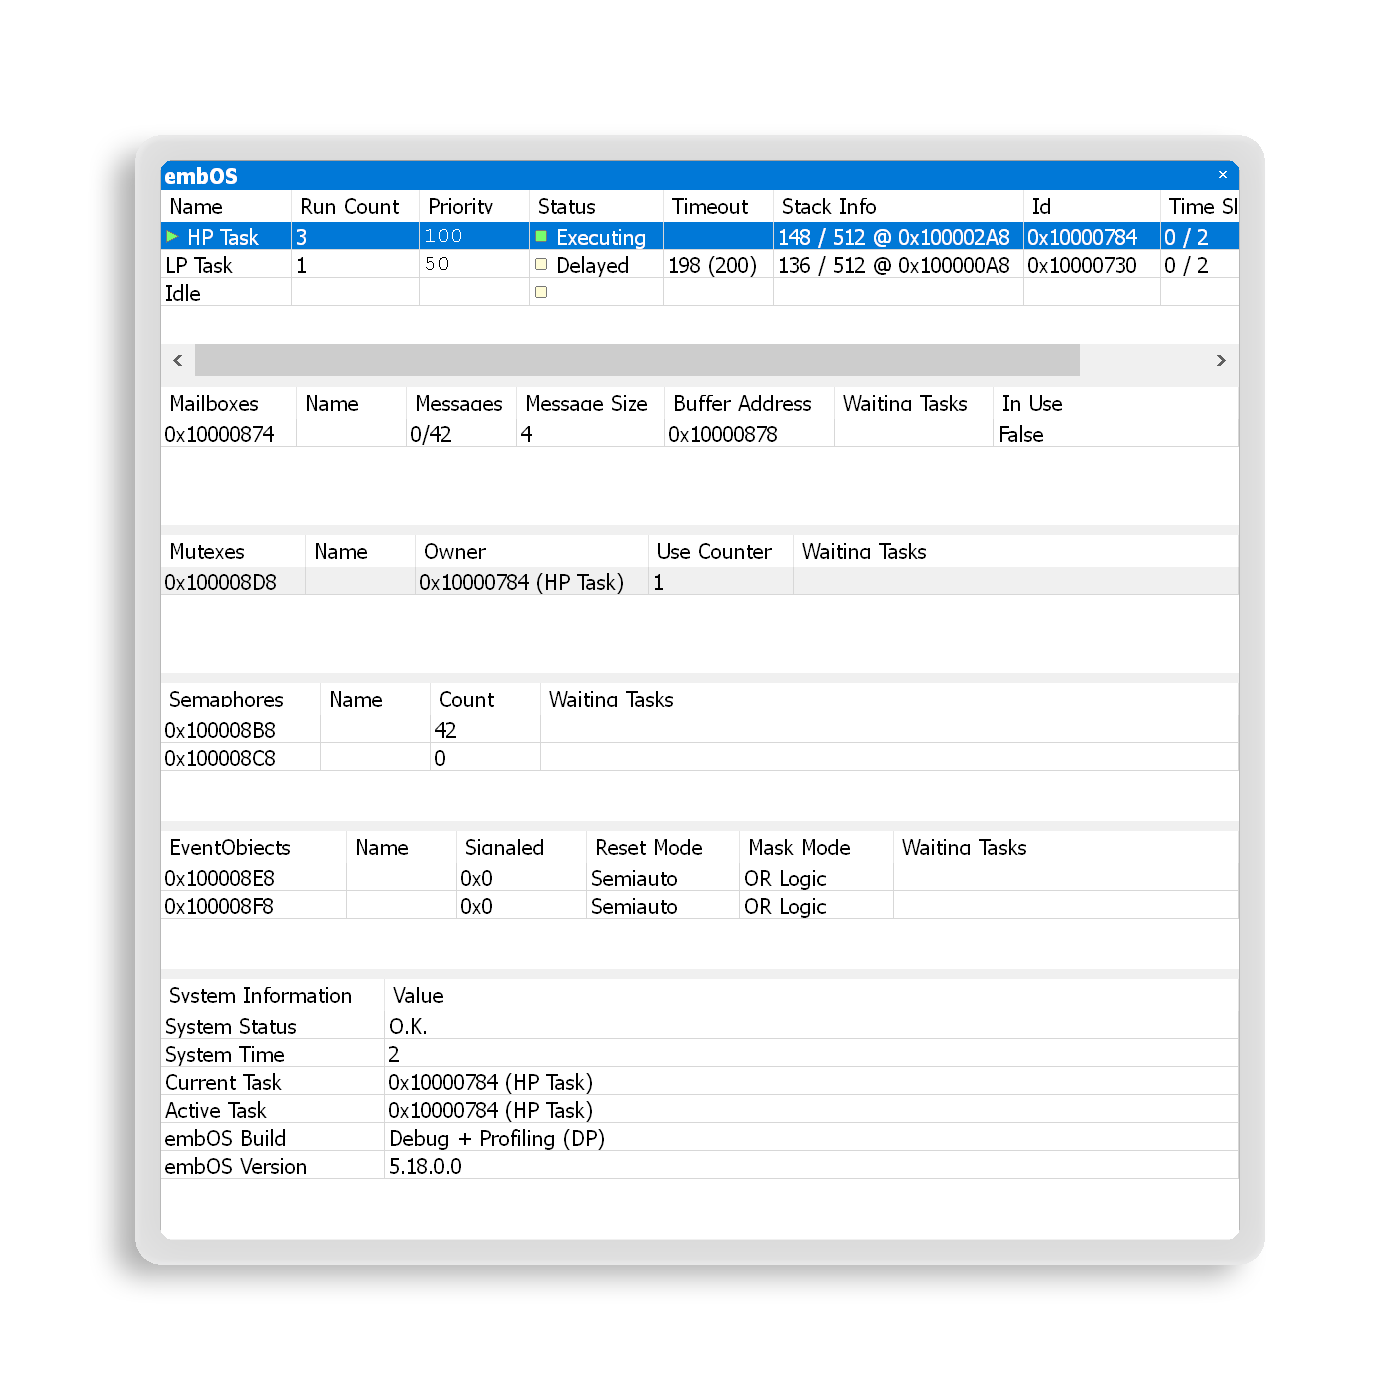
RTOS and middleware support
Ozone offers debug tools designed to address the growing complexity of modern embedded systems. To enable users to gain improved insight into the behavior of an RTOS or middleware, Ozone includes RTOS plug-ins and a SmartView interface for middleware.
System and performance analysis
Ozone helps developers understand how their embedded systems perform. It collects a wide range of valuable information, such as data on instruction traces, power consumption, and more. Its performance analysis features make it easier to understand and optimize a system.
Setup and test automation
For automation tasks, Ozone users can add scripts to a project or run them directly in the console. By utilizing scripts, users can create consistent and comprehensive verification and debug setups, as well as automated tests that do not require user interaction.
These scripts can perform almost all actions available through Ozone's graphical user interface. They can be used to configure the GUI and automate the debug work flow. Users also have access to event handlers, so they can create triggering events for specific actions within a script. Events include downloads, resets, halts, gos, and breakpoints. Users can set triggers to occur before, after, or at the time of an event.
Not supported Supported Depends on probe
System requirements
Operating systems
| Operating system | Version |
|---|---|
| Windows | Microsoft Windows (Arm/Intel) |
| macOS | macOS (Apple/Intel) |
| Linux | Linux (List of supported distributions) |
Hardware
| Hardware component | Item |
|---|---|
| CPU | 1GHz or better |
| Memory | 1GB RAM |
| Disk space | 1GB |
| Debug probe | J-Link, J-Trace, or GDB Server |
Licensing
For commercial use, SEGGER’s Commercial-use License is required. Licenses for Ozone are perpetual, meaning the tool can be used indefinitely and no annual subscription is required.
J-Link PLUS, J-Link Ultra, J-Link Pro, and J-Trace PRO include a free Ozone license. When using other debug probes, Ozone can be licensed separately for commercial use.
Latest news
Related content
Get in touch with us
Have questions or need assistance? Our Embedded Experts are here to help!
Reach out to us for:
- Licensing quotes
- Technical inquiries
- Project support