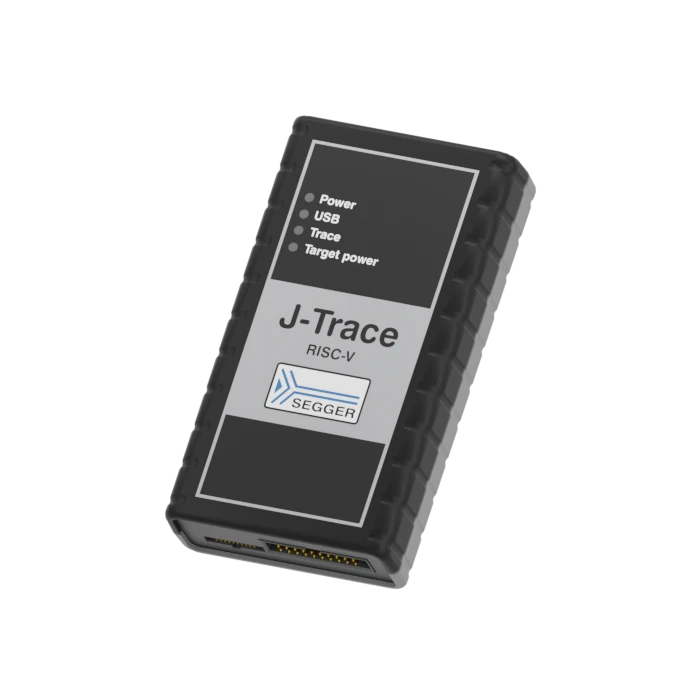
J-Trace PRO RISC-V
The RISC-V trace probe
- Combines J-Link debugging with advanced trace analysis and profiling
- Unlimited instruction trace recording to capture rare and hard-to-reproduce bugs
- Live Code Coverage and Live Code Profiling with high-speed streaming via USB 3.0
Overview
SEGGER's J-Trace PRO can capture complete traces over long periods — thereby enabling the recording of infrequent, hard-to-reproduce bugs. This is particularly helpful when the program flow ‘runs off the rails’ and stops in a fault state.
The J-Trace PRO RISC-V provides support for RISC-V-based microcontrollers. With its superspeed USB 3.0 interface, J-Trace PRO RISC-V enables continuous streaming trace via USB with full trace clock. It enables a far-reaching and complete analysis, offering fast and efficient data analysis, ensuring higher productivity while also lowering development risks and costs.
Key features
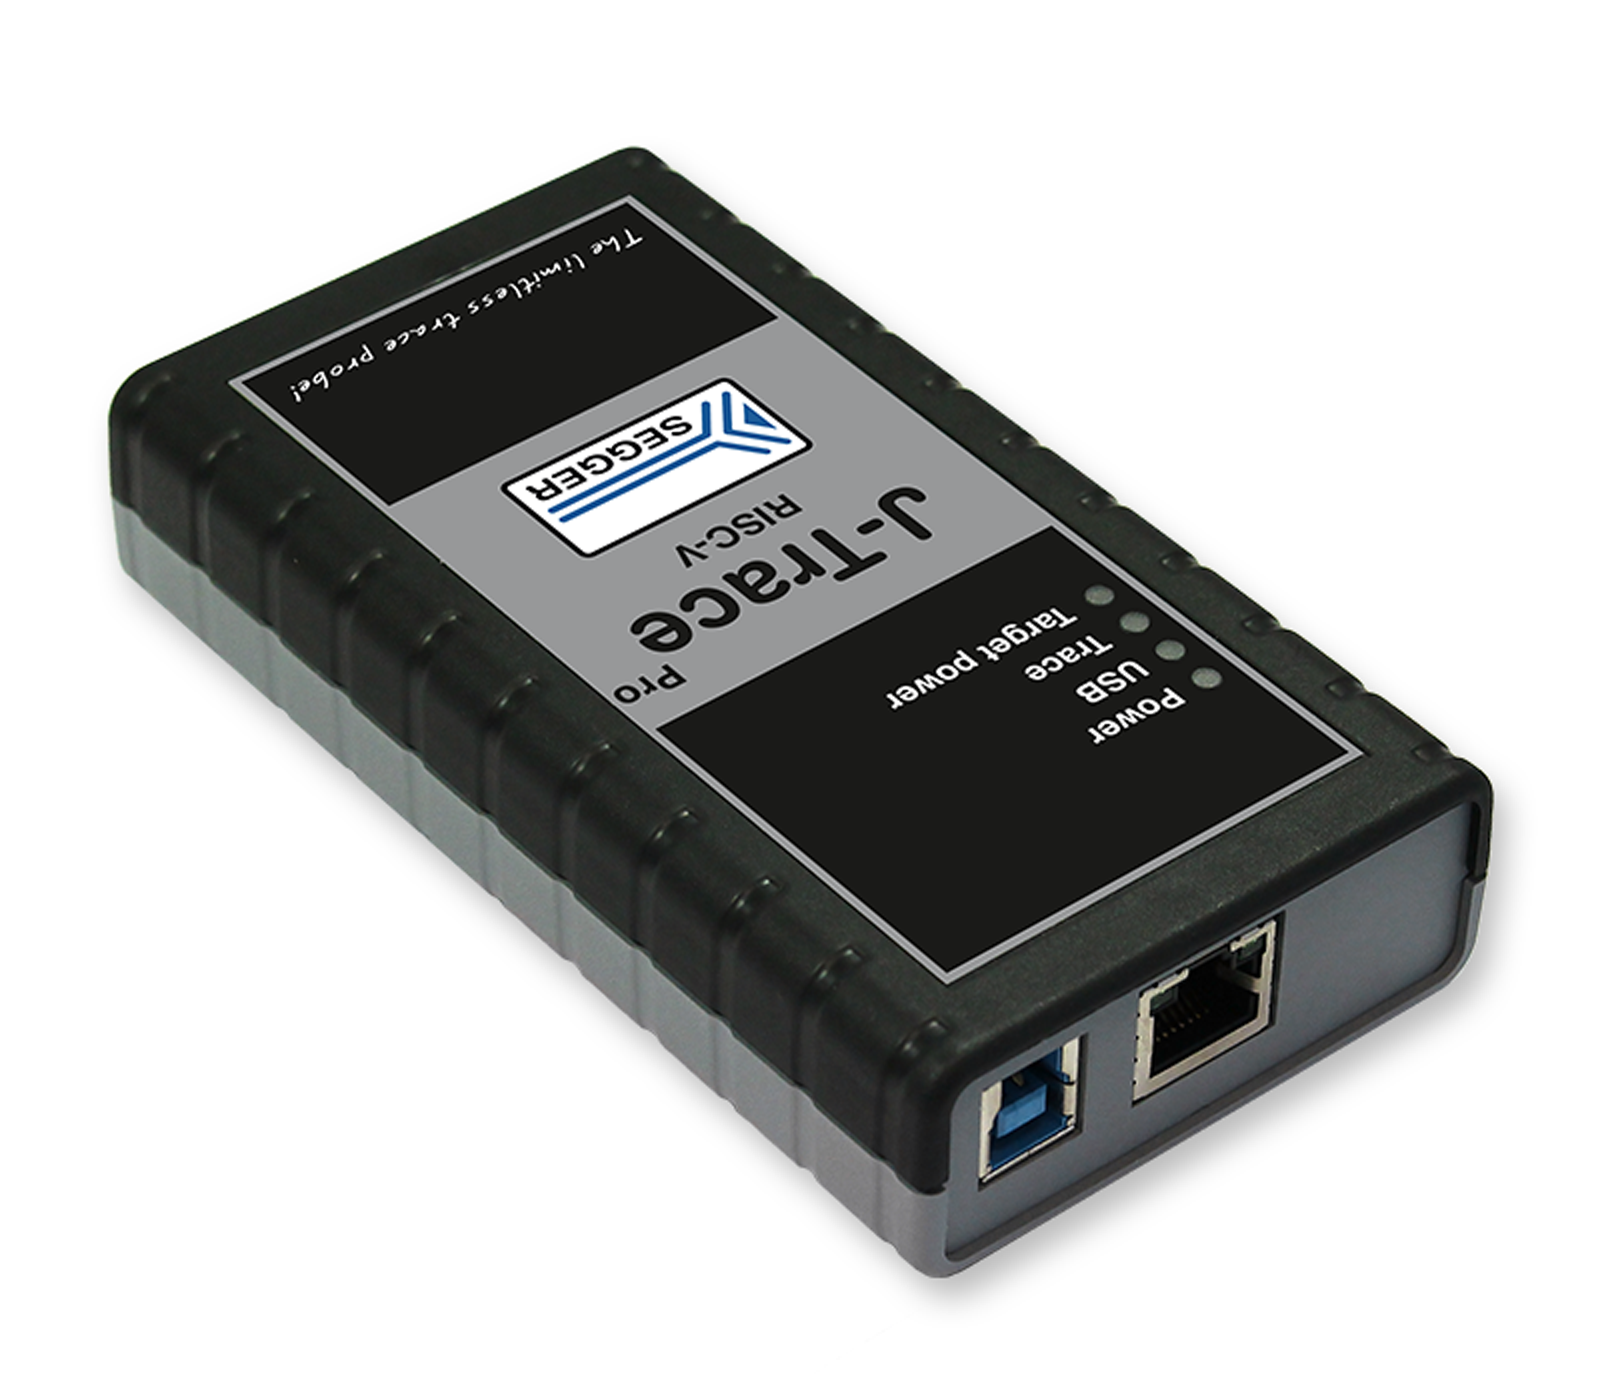
- Streaming trace probe with SuperSpeed USB3.0 interface and Gigabit Ethernet
- Download speed up to 4 MB/s
- Unlimited breakpoints in flash memory (Flash Breakpoints)
- Use with Ozone and J-Flash
- Real-time streaming trace at full System Clock
- Fine-tune applications with Live Code Profiling
- Instruction-level code coverage to satisfy regulatory requirements
- Unlimited trace to isolate & identify hidden code defects
- Supports RISC-V targets
- Full J-Link debug functionality
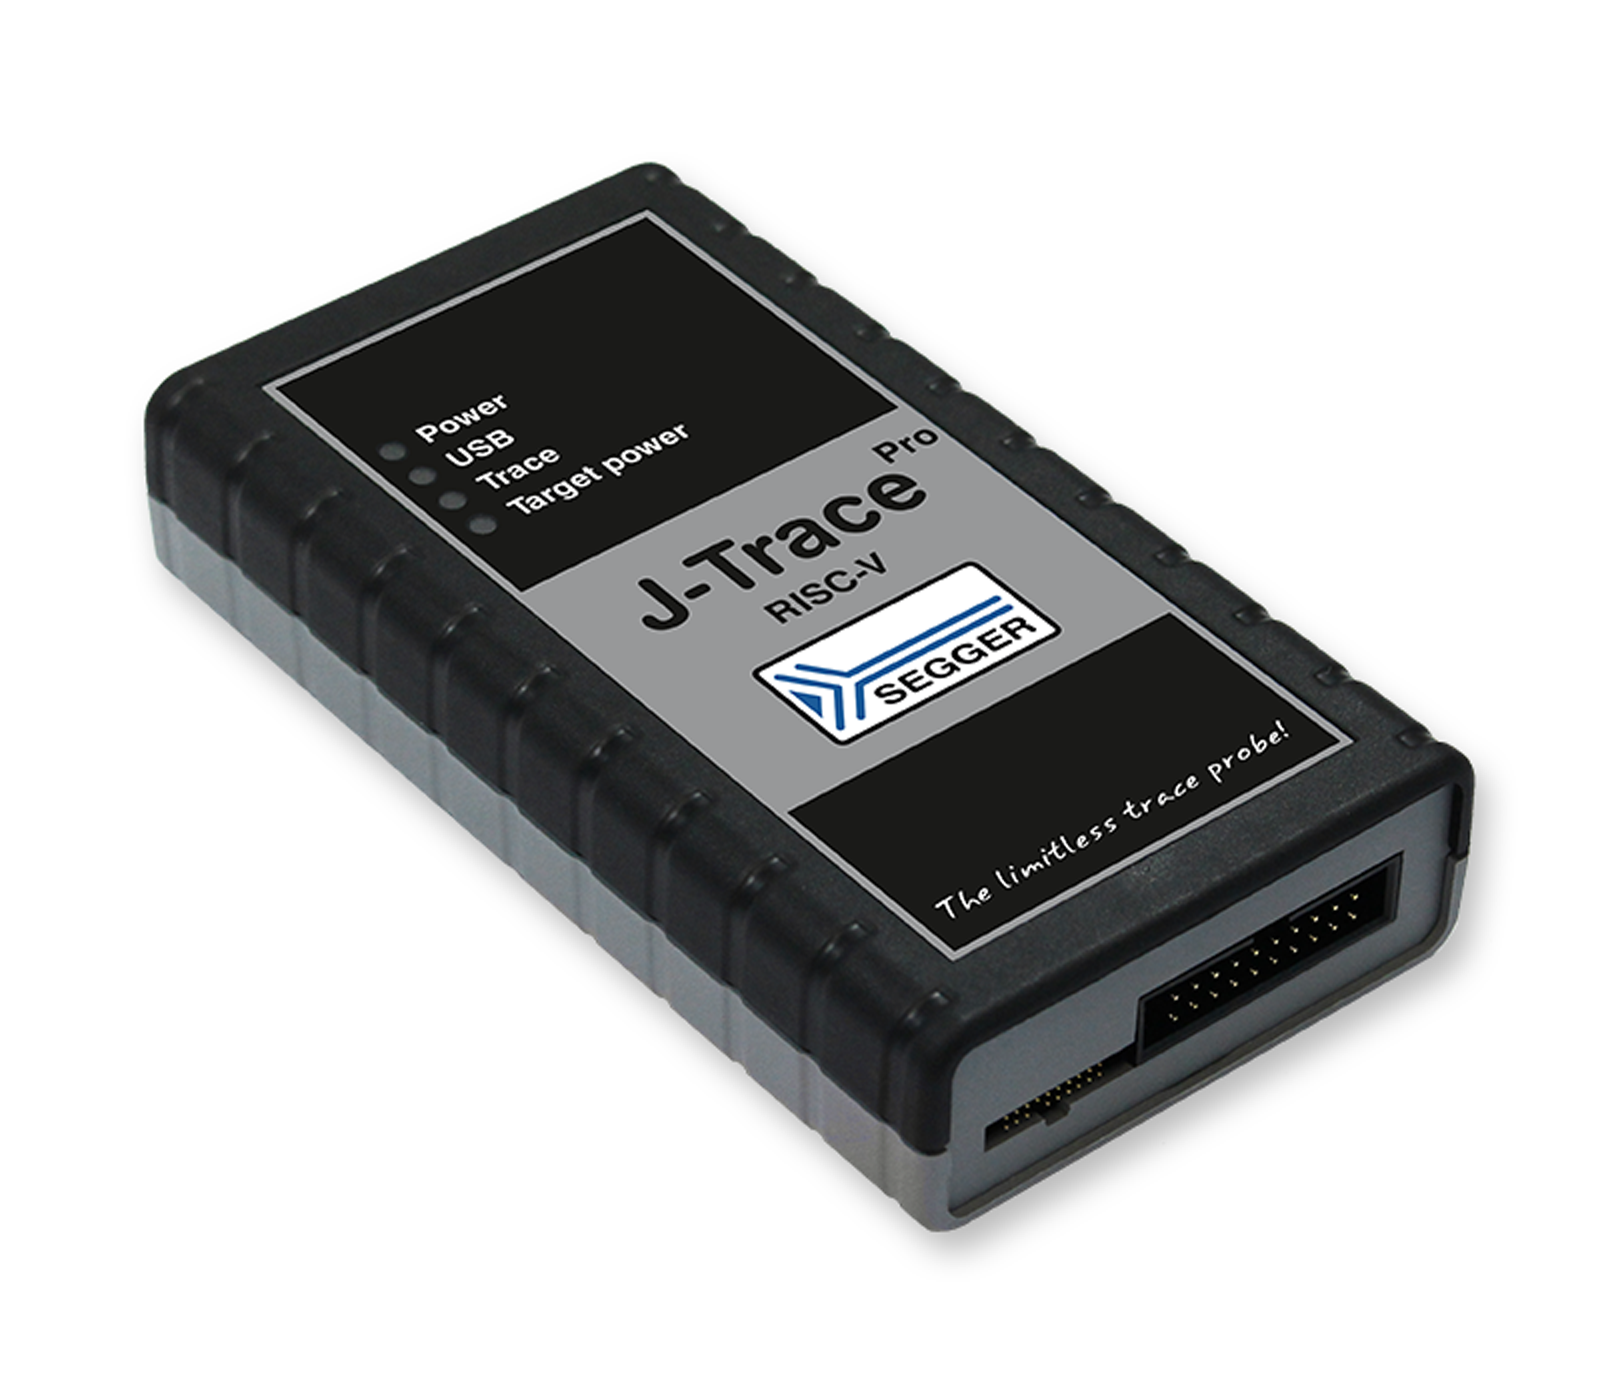
Debug and trace connector

J-Trace has two connectors. The pinout of the debug and trace connector is in the SEGGER knowledge base. The debug connector is for debug only and can be used with target adapters for J-Link.
Please note that only one connector can be used at a time!
Supported cores
SEGGER's J-Trace PRO RISC-V supports tracing on all E-Series SiFive RISC-V cores with the BTM trace module. The list of supported cores is available on our overview page.
Core not listed? Please don’t hesitate to contact us.
Software
All software is included free of charge.
For every J-Trace PRO, the J-Link Software and Documentation Package is available here:
Multi-platform
As a multi-platform solution, J-Trace PRO RISC-V comes with the setup and control software for Linux, macOS and Windows. Software and firmware updates are included. Similarly, use on all currently supported target devices, and any that will be added, is also included.
J-Flash
J-Flash is a part of the J-Link Software and Documentation package and allows the programming of the internal and external flash memory of a microcontroller-based embedded system via J-Trace.

Speed
Up to 4 MB/s download speed make J-Trace PRO the fastest trace probe on the market.
Flash Breakpoints
The J-Trace PRO RISC-V comes with an additional feature, called Unlimited Flash Breakpoints, which allows the user to set an unlimited number of breakpoints when debugging in flash memory.
Ozone — The multi-platform debugger and performance analyzer
Ozone is a full-featured graphical debugger for embedded applications. It includes all well-known debug controls and information windows and enables the best performance of J-Link debug probes and J-Trace trace probes. With Ozone it is possible to debug any embedded application on C/C++ source and assembly level. The Ozone Trace Tutorial allows developers to test the streaming and live analysis features of J-Trace PRO.
Instruction tracing
With streaming trace data users get deep insights into any application running on the target device whilst offering additional, powerful debug strategies to apply. It enables a far-reaching, yet complete, analysis of such issues, offering fast and efficient data analysis, ensuring higher productivity and also lowering development risks and costs.
Live Code Profiling
Code profiling details which instructions have been executed and how often. Users can address application runtime hotspots and identify opportunities to optimize them. It is all about measuring the execution time and frequency of functions, blocks and instructions and highlighting where computing time is spent. These profiles can later be exported using a tool like the Ozone debugger for documentation and analysis purposes.

Live Code Coverage
Through Live Code Coverage, engineers gain fully accurate information about how much of a source line, block, function, or file has been executed on a target application. It is this information that makes it possible to detect code that hasn’t been covered by tests — even code that may be unreachable. This enables a fast and efficient way to improve the code or to create a suitable test suite for uncovered blocks.

Media gallery
Technical specifications
| Specification | Value | |||||||
|---|---|---|---|---|---|---|---|---|
| Supported OS | Microsoft Windows (x86/x64), Linux (x86/x64/Arm), macOS (x86/Apple M1) | |||||||
| Electromagnetic compatibility (EMC) | EN 55022, EN 55024 | |||||||
| Operating temperature | +5°C ... +60°C | |||||||
| Storage temperature | -20°C ... +65 °C | |||||||
| Relative humidity (non-condensing) | Max. 90% rH | |||||||
| Mechanical | ||||||||
| Size (without cables) | 123mm x 68mm x 30mm | |||||||
| Weight (without cables) | (without cables) 120g | |||||||
| Available interfaces | ||||||||
| Ethernet interface | Gigabit | |||||||
| USB interface | USB 3.0, SuperSpeed | |||||||
| Target interface | JTAG/SWD 20-pin (14-pin adapter available) JTAG/SWD + Trace 19-pin | |||||||
| JTAG/SWD interface, electrical | ||||||||
| Power supply | USB-powered (max. 400mA) | |||||||
| Target interface voltage (VIF) | 1.2V ... 5V | |||||||
| LOW level input voltage (VIL) | VIL <= 40% of VIF | |||||||
| HIGH level input voltage (VIH) | VIH >= 60% of VIF | |||||||
| Reset type | Open drain with 100 Ohms series resistor. Can be pulled low or tristated | |||||||
| JTAG/SWD interface, timing | ||||||||
| Data input rise time (Trdi) | Max. 20ns | |||||||
| Data input fall time (Tfdi) | Max. 20ns | |||||||
| Data output rise time (Trdo) | Max. 10ns | |||||||
| Data output fall time (Tfdo) | Max. 10ns | |||||||
| Clock rise time (Trc) | Max. 10ns | |||||||
| Clock fall time (Tfc) | Max. 10ns | |||||||
| Trace interface, electrical | ||||||||
| Power supply | USB-powered (max. 400mA) | |||||||
| Target interface voltage (VIF) | 1.2V ... 5V | |||||||
| Voltage interface low pulse (VIL) | Max. 40% of VIF | |||||||
| Voltage interface high pulse (VIH) | Min. 60% of VIF | |||||||
| Capacitive load | 3 pF J-Trace + 8 pF cable (typical) | |||||||
| Trace interface | ||||||||
| Max. trace clock frequency | 150 MHz | |||||||
Assembly dimensions
Installing trace probes into fixtures has become quite common. To ease preparation, the 3D data of the J-Trace housing is available below.
Package content

FAQ
Q: What is the advantage of using the J-Trace PRO over other trace probes?
A: One of the biggest advantages of the J-Trace PRO is its streaming trace capability. Streaming trace allows for continuous live trace analyses, enabling debugging for even the most complex problems.
Q: Can I use the J-Trace PRO as a debug probe?
A: Yes. The J-Trace PRO includes all capabilities of the J-Link debug probes and comes with all licenses, such as for Unlimited Flash Breakpoints. It can be used with the J-Link software as well as with any tool that supports the J-Link.
Q: Can the J-Trace PRO be used with any IDE?
A: Yes. The J-Trace PRO can be used with all common IDEs, just like any J-Link debug probe.
Q: Can any IDE be used for tracing as well?
A: Unfortunately most IDE vendors do not offer trace analysis features. If they do, it is only to a limited degree.
Q: What can I use for tracing and analysis?
A: We recommend using the graphical standalone debugger Ozone. It supports all J-Trace PRO capabilities and compliments them with its advanced analysis features. Ozone can be used independent of a compiler, with the output of any IDE or toolchain. It can also be used completely free of charge with a J-Trace PRO, even for commercial use.
Q: What do I need in order to trace with a J-Trace PRO?
A: Just connect the target device and start debugging. J-Trace PRO is designed to simply get working. It can be up and running in less than 10 minutes.
Q: Where can I find trace-related troubleshooting information?
A: Tracing is a very hardware-dependent debug technique, and some target hardware modifications or designs can cause issues when trying to set up the trace debug interface. To give our customers a easy-to-use troubleshooting platform with the most asked questions answered, we have created the following setup page: Setting up trace.
Any more questions? Please contact us.
Q: Are there any trace example projects that I can use for orientation?
A: Yes, we created a list of tested devices that each come with an example project that runs out-of-the-box with a J-Trace PRO and Ozone. The list is available here and is updated regularly.
Q: My device is not on the tested devices list, what can I do to get an example project for it?
A: The trace-capable MCU market is growing and it is becoming harder to keep track of all devices. If we don't happen to have a trace example for your particular device, please feel free to contact us.
The requirements for adding a new example project are:
- Must be supported by J-Link software: overview of supported CPUs and devices
- The target hardware must be publicly available and an evaluation board.
- Trace pins must be physically connected to the trace debug interface.
