Live Code Coverage
The J-Trace PRO streaming trace capability can provide completely accurate information about the instruction execution on a target system. This enables a full code coverage analysis of the system which can be updated while the target is running.
What is code coverage?
Code coverage metrics are a way to describe the "quality" of code, as "code that is not tested does not work".
A code coverage analyzer measures the execution of code and shows how much of a source line, block, function or file has been executed. With this information it is possible to detect code which has not been covered by tests or may even be unreachable. This enables a fast and efficient way to improve the code or to create a suitable test suite for uncovered blocks.
In systems which interface with peripherals, such as USB, IP stacks or other components, these tests should be run on actual hardware. Simulation environments on a computer cannot replicate timing, or other characteristics, of real hardware that might affect program execution.
In addition, as with code profiling, code coverage analysis can be intrusive, by instrumenting code, or non-intrusive, by tracing the program counter. Code instrumentation might not work well with hard-real-time requirements of code and can therefore not be used to analyze advanced embedded systems.
With a J-Trace PRO, code coverage analysis is completely non-intrusive. It does not modify the code or alter the execution. With the streaming trace capability, a whole test suite can be run in one go without requiring to halt or reload the test application.
Code coverage with J-Trace PRO
Code coverage analysis is usually done with a test application, which triggers different routines of the actual code. And the routines run as they would do in the final system based on the given parameters. While the test runs, J-Trace PRO records the instruction trace data and sends it to the host which immediately analyzes it.
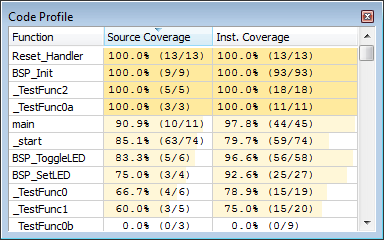
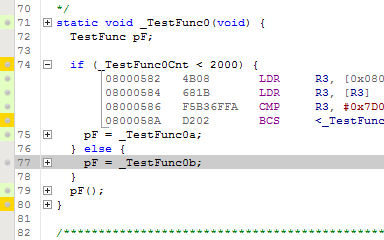
A code coverage tool or debugger application, such as Ozone, gets the analyzed information and shows exactly which instructions or lines of code have been executed by running the test. In Ozone this is done by highlighting executed lines in the source viewer.
The code coverage information does not only show which lines have been fully executed, i.e. all instructions of a line are executed, but it can also show where conditions have not yet been fully met, i.e. have not been true and false. The highlighting of source lines provide a quick overview on which code has been covered. Uncovered source lines or blocks might then require additional test parameters to be tested, or need to be improved, fixed, or rewritten.
Additionally it is possible to create full code profile reports for analyzed modules or applications. These records include information about how many lines and instructions of each function are covered. Code coverage reports are usually required to be stored for QA processes or certification.
Exporting the code coverage analysis
With Ozone, the code coverage analysis can be exported into a text file to be stored with the system's documentation for QA reports or certification.
Code profile and coverage reports can be generated for the whole application, for selected modules (source files), or for selected functions only. To create a report, right-click in the Code Profile Window and select export.
An example report from the J-Trace PRO Cortex-M example project is shown here:
Ozone Code Profile Report

Project:       Start\SEGGER_CortexM_Trace_Reference_Board.jdebug
Application:   Start/Output/Debug NoOS NoSystemInit/SEGGER Cortex-M Trace Reference Board.elf


Code Coverage Summary

Module/Function   |        Source Lines                 |        Instructions
------------------+-------------------------------------+-------------------------------------
BSP.c             |                                     |
  BSP_Init        |            9 /    9         100.0%  |           93 /   93         100.0%
  BSP_SetLED      |            3 /    4          75.0%  |           25 /   27          92.6%
  BSP_ToggleLED   |            5 /    6          83.3%  |           56 /   58          96.6%
TraceDemo.c       |                                     |
  _TestFunc0      |            5 /    6          83.3%  |           18 /   19          94.7%
  _TestFunc0a     |            3 /    3         100.0%  |           11 /   11         100.0%
  _TestFunc0b     |            3 /    3         100.0%  |            9 /    9         100.0%
  _TestFunc1      |            4 /    5          80.0%  |           19 /   20          95.0%
  _TestFunc2      |            5 /    5         100.0%  |           18 /   18         100.0%
  main            |           10 /   11          90.9%  |           44 /   45          97.8%
------------------+-------------------------------------+-------------------------------------
  Total           |           47 /   52          90.4%  |          293 /  300          97.7%