Live Code Profiling
With the J-Trace PRO streaming trace capabilities, trace data is analyzed in real time while the data is transferred from the target system to the host computer. The analyzed data contains information about which instructions have been executed on the target, whether conditional instructions have taken both paths, and how often each instruction has been executed. With the captured trace data, a debugger can analyze an application to construct a code profile and identify "hot spots" for potential optimization.
What is code profiling?
Code profiling is a form of measuring the execution time and the execution count of functions, blocks or instructions. It can be used as a metric for the complexity of a system and can highlight where computing time is spent. This provides a great insight into the running system and is essential when identifying code that is executed frequently, potentially placing a high load onto a system. The code profiling information can help to easier optimize a system, as it accurately shows which blocks take the most time and are worth optimizing.
There are two methods to gather code profiling information: code instrumentation and instruction pointer (PC) sampling.
Code instrumentation
With code instrumentation the target application is modified by adding special recording functions at code locations which are of interest, such as on function call and return. The code profiler can then read and analyze the recorded data. SystemView is one of those instrumenting profilers, especially designed for embedded systems.
Instrumenting profilers can measure the time spent in each function and nested function calls with high accuracy. But any instrumentation impacts the runtime behavior of the target system, as additional code, so additional instructions, needs to be executed. Code instrumentation may not be suitable for systems with hard-real-time requirements.
PC sampling
PC sampling in contrast does not require any code modification. Even better, as the PC sampling facilities are part of the core, they can monitor it without any intrusive effect on its execution.
On Arm Cortex devices PC sampling can be done with either of two core modules: the DWT unit or the ETM.
With the DWT unit, the PC can be sampled at a configurable interval and its value can be sent to the debug probe on the SWO pin. PC sampling with the DWT unit can provide a rough overview on the system execution to show bottlenecks and high-load routines. But as the PC can only be sampled with a low frequency compared to the CPU speed, the execution count and timing information can only be approximated and short routines might go completely undetected.
With the ETM any step that the core does is detected. It records instruction execution, non-execution of conditional instructions and interrupts, and sends it out on the trace pins which the trace probe can connect to. With the instruction trace data a profiler or debugger application can exactly measure the execution time of functions and get a call graph of each function call, the same as code instrumentation.
Code profiling with J-Trace PRO
As J-Trace PRO connects to the trace pins on the debug interface, it gets the ETM instruction trace data. And with its streaming trace capability, this data is immediately sent to the host. Thus it is possible to get the most accurate code profiling information.
Code profiling with J-Trace PRO can be done without any source modification and is even possible on production code.
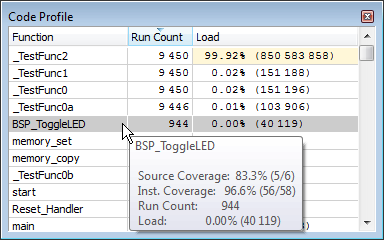
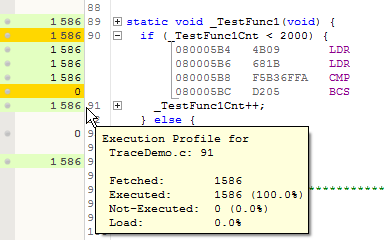
The analyzer, which is part of the J-Trace interface to a debugger, decodes the trace data and stores the execution count of each instruction of the system. A debugger such as Ozone can map the execution counts to the high-level source code and show the number of execution for each function, block, or source line. The code profiling data can be updated in real time, while the target system is running. This allows identifying time-consuming or frequently called routines which may help to selectively optimize the system.
Exporting the code profile information
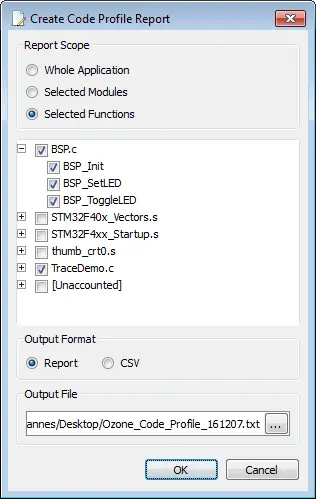
With Ozone, the code profiling information can be exported into a text file to be stored with the system's documentation for QA reports or certification. Code profile reports can be generated for the whole application, for selected modules (source files), or for selected functions only. To create a report, right-click in the Code Profile Window and select export.
An example report from the J-Trace PRO Cortex-M example project is shown here:
Ozone Code Profile Report

Project:       SEGGER_CortexM_Trace_Reference_Board.jdebug
Application:   SEGGER Cortex-M Trace Reference Board.elf


Code Profile Summary

Module/Function   |   Run Count   |   Load
------------------+---------------+----------------
BSP.c             |               |
  BSP_Init        |            1  |           230
  BSP_SetLED      |            1  |            26
  BSP_ToggleLED   |          944  |        40 119
TraceDemo.c       |               |
  _TestFunc0      |        9 450  |       151 196
  _TestFunc0a     |        9 446  |       103 906
  _TestFunc0b     |            4  |            36
  _TestFunc1      |        9 450  |       151 188
  _TestFunc2      |        9 450  |   850 583 858
  main            |            1  |       195 593
------------------+---------------+----------------
  Total           |       38 747  |   851 226 152