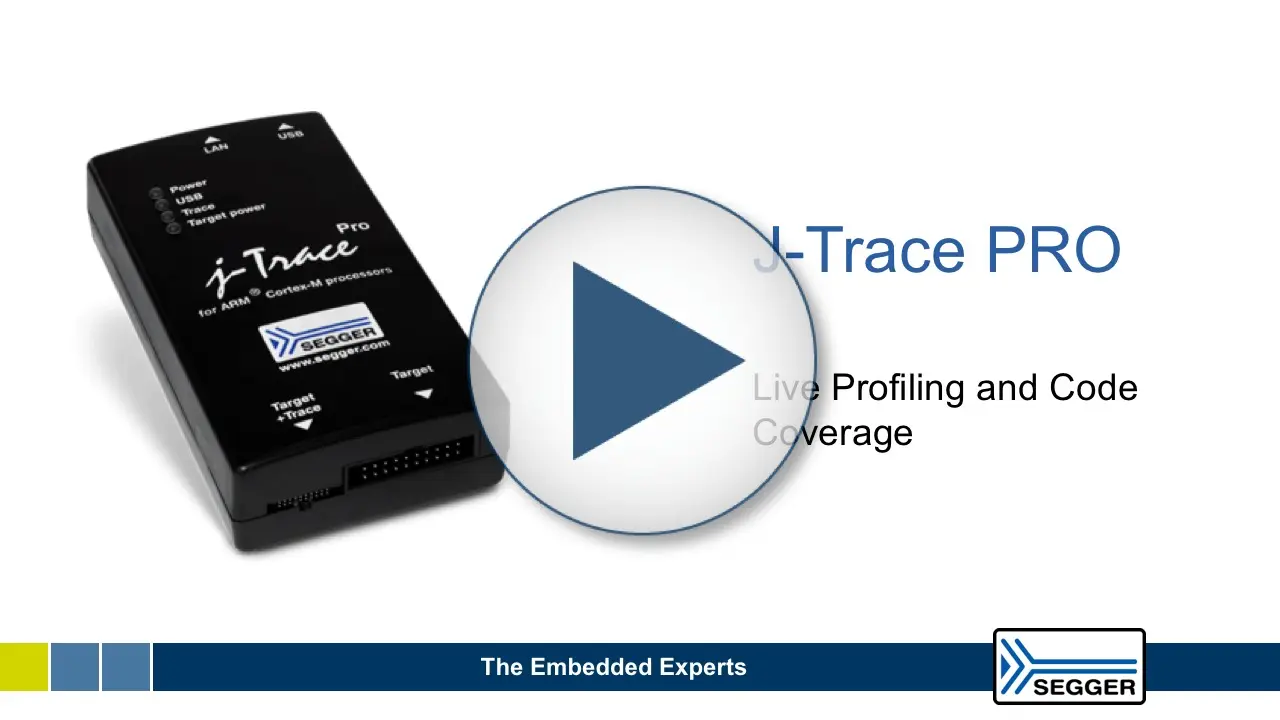
Streaming trace
J-Trace PRO features continuous streaming trace from embedded Arm Cortex systems, which enables non-intrusive live trace data analysis and instruction tracing on the host computer while the target system is running.
What is streaming trace?
Arm Cortex devices include an Embedded Trace Macrocell (ETM), which can be utilized to observe the core execution and continuously output these observations, the trace data, via trace pins while the device is running.
The J-Trace PRO reads the trace data from the trace pins and sends it to the host machine running the analysis.
Using J-Trace PRO with the ETM does not influence the system's runtime behavior and does not require any code instrumentation. The system can run in product-ready release mode.
To date most debug probes capture trace data to limited internal memory and only send that data to the host when the target is halted. J-Trace PRO sends all trace data continuously in real time, while the target system is running. This enables endless trace stream recording and and supports a complete analysis of the system behavior from system boot.
Trace data is essential for debugging any multi-tasking, interrupt-driven system, especially to shed light on difficult-to-find code issues, timing-impaired problem, and non-apparent inefficiencies, where system instrumentation and conventional breakpoint debugging do not help.
Streaming trace data enables a far-reaching, yet complete, analysis of such issues, offering fast and efficient data analysis, ensuring higher productivity and also lowering development risks and costs.
Unlimited instruction trace
The main information which can be retrieved from the trace data is the execution flow of the system, so which instructions have been executed or not executed.
Debugger applications can visualize the instruction trace data, usually done in a backtracing fashion. The most recently executed instructions are displayed and optionally mapped to the application's sources. This allows navigating through them to see what happened last in the target system.
With non-stream trace probes, the available instructions for backtracing is limited to the internal trace buffer of the trace probe, which only holds the latest trace data when the target system is halted. Using target system internal trace capabilities, like the Embedded Trace Buffer (ETB), which can store a few kilobytes of trace data in internal RAM, limits the available trace data even more.
The J-Trace PRO streaming trace capability technically enables instruction tracing of the whole system execution from the startup to its current point.
To find issues in the execution a limited trace buffer might be sufficient, but streaming trace allows a complete analysis of the system to be used for code coverage and profiling analysis.
Live analysis of trace data
The trace data received from J-Trace PRO is analyzed in real time. This enables live updates of trace information windows in debugger applications, while the target is running, enabling code coverage and profiling analysis on actual hardware. With streaming trace data no simulation environment is required and the real behavior of a system can be monitored.
Try out streaming trace and analyse an application within 15 minutes with the Ozone J-Trace PRO tutorial project.
