J-Trace streaming trace probes
Complete instruction tracing.
- Record complete instruction traces over unlimited periods of time
- Analyze runtime behavior with live code coverage and live code profiling
- Combine full J-Link debugging capabilities with high-speed streaming trace
Key features
Real-time instruction trace
Captures every executed instruction non-intrusively in real time, which enables developers to pinpoint hard-to-find issues and thoroughly understand program flow.
Live code coverage and profiling
Tracks executed code and measures performance in real time, supporting optimization of applications and revealing untested or inefficient sections.
Same licenses and features as J‑Trace Pro
Comes with the full set of J‑Link Pro licenses and capabilities, ensuring seamless debugging and compatibility across a wide range of microcontrollers and development environments.
J-Trace models
All SEGGER J-Trace models share the same advanced feature set and tool compatibility. The key difference between models lies in the type of devices and architectures they support. From multi-architecture solutions to specialized models for Arm Cortex-M, Cortex-A/R/M, and RISC-V, each J-Trace provides the same professional performance and reliability tailored to specific target families.
A detailed overview of all models and their specifications is available in a comprehensive comparison table.
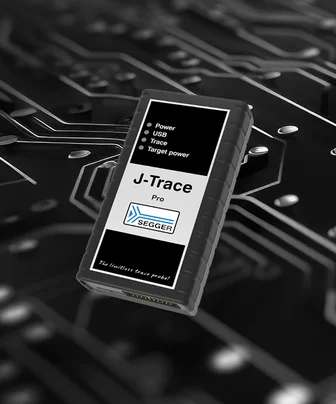
J-Trace PRO
The multi-architecture trace probe
The J-Trace PRO is SEGGER's "all-in-one" streaming trace probe for any CPU core and architecture.
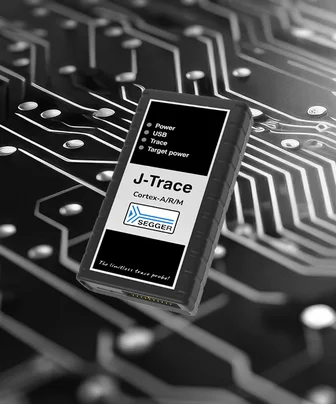
J-Trace PRO Cortex-A/R/M
The Arm Cortex trace probe
The J-Trace PRO for Cortex-A/R/M-based microcontrollers supports tracing on a wide range of Arm Cortex cores.
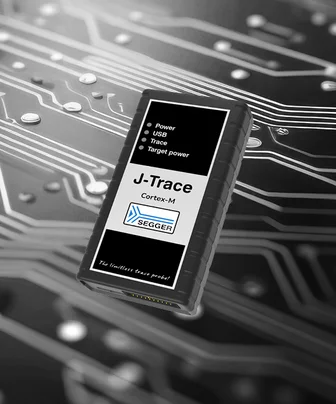
J-Trace PRO Cortex-M
The leading trace probe
The J-Trace PRO for Cortex-M-based microcontrollers enables continuous streaming trace for code development and optimization.
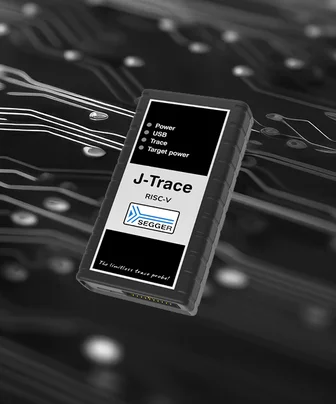
J-Trace PRO RISC-V
The RISC-V trace probe
J-Trace PRO for RISC-V-based microcontrollers supports tracing on a wide range of RISC-V cores.
Debug and trace connectors
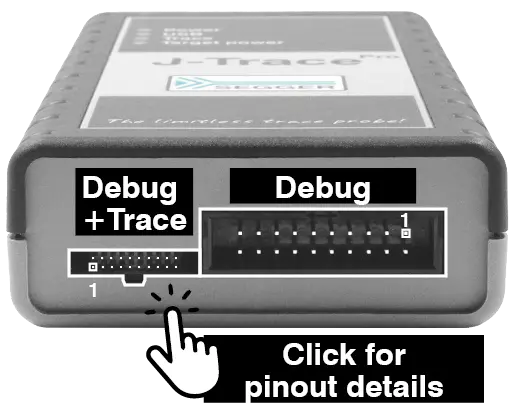
J-Trace has two connectors. The pinout of the debug and trace connector is in the SEGGER knowledge base. The debug connector is for debug only and can be used with target adapters for J-Link.
Please note that only one connector can be used at a time.
Supported devices
The list of supported manufacturers, families, devices, and SoCs includes tens of thousands of devices in hundreds of device families.
Device not listed? Please don’t hesitate to contact us.
Comparison
| J-Trace PRO | J-Trace PRO Cortex-A/R/M | J-Trace PRO Cortex-M | J-Trace PRO RISC-V | |
|---|---|---|---|---|
| Hardware features | ||||
| Power supply | USB | USB | USB | USB |
| Download speed into RAM [1] | 4.0 MB/s | 4.0 MB/s | 4.0 MB/s | 4.0 MB/s |
| Max. CPU frequency | Unlimited | Unlimited | Unlimited | Unlimited |
| Max. TPIU frequency | 300 MHz | 300 MHz | 300 MHz | 300 MHz |
| Max. trace clock frequency | 150 MHz | 150 MHz | 150 MHz | 150 MHz |
| Max. SWO speed | 100 MHz | 100 MHz | 100 MHz | 100 MHz |
| Max. target interface speed | 50 MHz | 50 MHz | 50 MHz | 50 MHz |
| Host interfaces | ||||
| Ethernet | ||||
| USB | ||||
| Target interfaces | ||||
| cJTAG | ||||
| JTAG | ||||
| Arm SWD | ||||
| Arm SWO | ||||
| RISC-V SWD | ||||
| Trace interfaces | ||||
| Unlimited streaming trace + Live analysis [2] | ||||
| Buffer Trace | ||||
| Supported trace encoders | ||||
| Cortex-M ETM Trace | ||||
| Cortex-A ETM Trace | ||||
| Cortex-R ETM Trace | ||||
| Cortex-A PTM Trace | ||||
| RISC-V N-Trace BTM | ||||
| Software features | ||||
| Flash Download | ||||
| GDB Server | ||||
| J-Flash | ||||
| J-Flash SPI | ||||
| Ozone | ||||
| RDI | ||||
| Real-Time Transfer (RTT) | ||||
| Unlimited Flash Breakpoints | ||||
| Supported Arm cores | ||||
| Cortex-A5 | ||||
| Cortex-A7 | ||||
| Cortex-A8 | ||||
| Cortex-A9 | ||||
| Cortex-A12 | ||||
| Cortex-A15 | ||||
| Cortex-A17 | ||||
| Cortex-A32 | ||||
| Cortex-A35 | ||||
| Cortex-A53 | ||||
| Cortex-A55 | ||||
| Cortex-A72 | ||||
| Cortex-M0 | ||||
| Cortex-M0+ | ||||
| Cortex-M1 | ||||
| Cortex-M3 | ||||
| Cortex-M4 | ||||
| Cortex-M7 | ||||
| Cortex-M23 | ||||
| Cortex-M33 | ||||
| Cortex-M52 | ||||
| Cortex-M55 | ||||
| Cortex-M85 | ||||
| Cortex-R4 | ||||
| Cortex-R5 | ||||
| Cortex-R8 | ||||
| Cortex-R52 | ||||
| SC000 (M0 secure) | ||||
| SC300 (M3 secure) | ||||
| Supported Arm legacy cores | ||||
| Arm7 | ||||
| Arm9 | ||||
| Arm11 | ||||
| Supported Cadence cores | ||||
| HiFi 1 | ||||
| HiFi 3 | ||||
| HiFi 3z | ||||
| HiFi 4 | ||||
| HiFi 5 | ||||
| Fusion F1 | ||||
| Xtensa LX6 | ||||
| Xtensa LX7 | ||||
| Supported Microchip PIC32 cores | ||||
| Microchip PIC32MX | ||||
| Microchip PIC32MZ | ||||
| Supported Renesas RX cores | ||||
| Renesas RX110 | ||||
| Renesas RX111 | ||||
| Renesas RX140 | ||||
| Renesas RX210 | ||||
| Renesas RX21A | ||||
| Renesas RX220 | ||||
| Renesas RX610 | ||||
| Renesas RX621 | ||||
| Renesas RX62G | ||||
| Renesas RX62N | ||||
| Renesas RX62T | ||||
| Renesas RX630 | ||||
| Renesas RX631 | ||||
| Renesas RX63N | ||||
| Renesas RX63T | ||||
| Renesas RX660 | ||||
| Supported RISC-V cores | ||||
| E20 | ||||
| E21 | ||||
| E24 | ||||
| E31 | ||||
| E34 | ||||
| E61 | ||||
| E61-MC | ||||
| E76 | ||||
| E76-MC | ||||
| Supported SiLabs 8051 cores | ||||
| EFM8 | ||||
Supported Debug support: Run control, memory access, etc. Pin trace supported Not supported
[1] The download speeds listed here are the peak download speeds that can be achieved by the particular J-Trace model. The actual download speed may be lower as it depends on various factors, such as, but not limited to: The selected debug interface & speed, the CPU core and its operating frequency, other devices in the JTAG chain in case JTAG is used as target interface.
[2] Unlimited streaming trace allows to transmit trace in real time to the PC. While traditional trace only allows to see and analyze the last xxx MB of trace data, with streaming trace it is possible to have all data available. This allows extended debugging features, such as code coverage or CPU load analysis based on a function basis.
Media gallery
Getting started
J-Trace PRO is designed to work out-of-the-box with most trace-capable target devices. In all other cases J-Trace PRO offers additional features that can make any trace setup possible. It has never been easier to get a trace up and running.
Latest news
Get in touch with us
Have questions or need assistance? Our Embedded Experts are here to help!
Reach out to us for:
- Licensing quotes
- Technical inquiries
- Project support