SystemView
The real-time software-analysis tool
- Embedded-testing tool to analyze and profile the behavior of real-time systems
- Visualizes tasks, interrupts, and software timers with detailed timing information
- Helps identify inefficiencies, resource conflicts, and unintended interactions in complex multi-threaded systems
Key features
SystemView provides powerful features and is minimally intrusive, which makes it an essential tool for embedded-system development. It works with any CPU, RTOS, or bare-metal system, ensuring high flexibility and adaptability for a variety of different setups. Due to its compatibility, developers can use SystemView across a wide range of embedded software projects.
Multicore support

SystemView enables seamless recording and analysis for embedded systems with multiple CPU cores on a single microcontroller, allowing users to gain synchronized insights into interactions. It supports diverse architectures and provides a unified and detailed view of even the most complex systems.
Continuous recording

SystemView captures tasks, interrupts, timers, resources, API calls, and user events in real time. This means embedded developers can fully analyze a system's runtime behavior with minimal intrusion.
For applications with high trace bandwidth requirements, J-Link Ultra and J-Link Pro are the recommended debug probes, providing the highest RTT throughput for continuous recording.
Data sampling
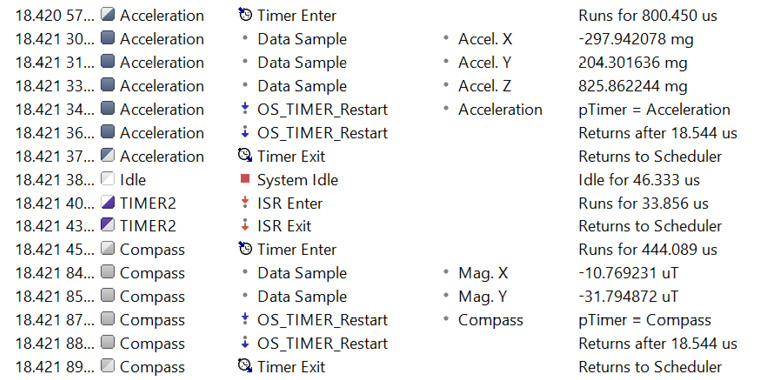
SystemView allows various target-system data to be recorded and processed. The number of sample sources for graphing is unlimited and can be configured on the target. Data samples are recorded, analyzed, and visualized in real time as the system runs.
Use cases
SEGGER's SystemView provides deep insights into embedded-system operation. It supports a wide range of applications, from verifying system behavior, to optimizing performance, to analyzing complex interactions in multithreaded environments. Its versatility makes it a valuable tool for understanding and improving embedded software systems.
Analyze complex embedded systems with multiple threads and events
For complex systems with multiple threads, interrupts, and events, SystemView delivers a deeper level of insight than traditional debugging tools. By capturing and analyzing interactions across all embedded system components, it reveals intricate relationships and potential conflicts that may not be visible through conventional methods.
Verify embedded system behavior
SystemView enables precise verification of system behavior by providing real-time visualization of task execution, interrupts, and API calls. By capturing a detailed timeline of events, it becomes easier to ensure that all parts of the system are functioning as designed. This helps in identifying irregularities or unexpected behavior early in the embedded software development process, leading to more reliable and robust systems.

Optimize resources and performance
With its detailed timing analysis, SystemView enables in-depth evaluation of resource usage and performance. It highlights inefficiencies, such as excessive CPU load or poorly distributed task execution, and provides actionable insights to optimize embedded system performance. By fine-tuning task scheduling, memory allocation, and runtime behavior, developers can achieve significant improvements in overall efficiency and responsiveness.

How SystemView works
SystemView operates by integrating a small software module, containing SystemView and RTT, into the target system. The instrumentation code is available at: https://github.com/SEGGERMicro/SystemView. This module collects event data, formats it, and passes it to the RTT module. The RTT module stores the data in the target buffer, which enables continuous recording with a J-Link on supported systems, as well as single-shot and post-mortem mode recording on any system. Events such as interrupt start and end are monitored and stored with high-accuracy timestamps, configurable down to a single CPU cycle (5 ns on a 200 MHz CPU).
The SystemView module is efficient, requiring less than 2 KB of ROM and about 600 bytes of RAM for continuous recording using J-Link. It imposes minimal overhead—less than 1% on a system with 10,000 events per second on a 200 MHz Cortex-M4. Data is transferred via the debug interface, requiring no additional hardware or pins. The tool can be used on any system that offers debug access.
Adding SystemView to a target embedded system is straightforward. Only a small set of files needs to be included in the project, and depending on the system, as little as one function call or two lines of code per interrupt are needed. This simple setup can typically be completed within minutes, enabling efficient and precise event monitoring.
More information on how SystemView works is available in the SystemView user manual.
Additional features
Heap monitoring

Tracks memory allocations in real time, helping developers identify inefficiencies and memory leaks. By highlighting peak usage and pinpointing allocation sources, it provides actionable insights to resolve issues and optimize resource management.
DataPlot window

Visualize variables, sensor data, and custom metrics in real time alongside recorded events. This synchronized, scope-like view provides deep insights into embedded system behavior for precise debugging and optimization.
CPU load analysis

Identify bottlenecks and high-load periods, allowing embedded software developers to balance workloads and ensure timely execution of critical tasks. Visual feedback helps optimize performance for smoother operations.
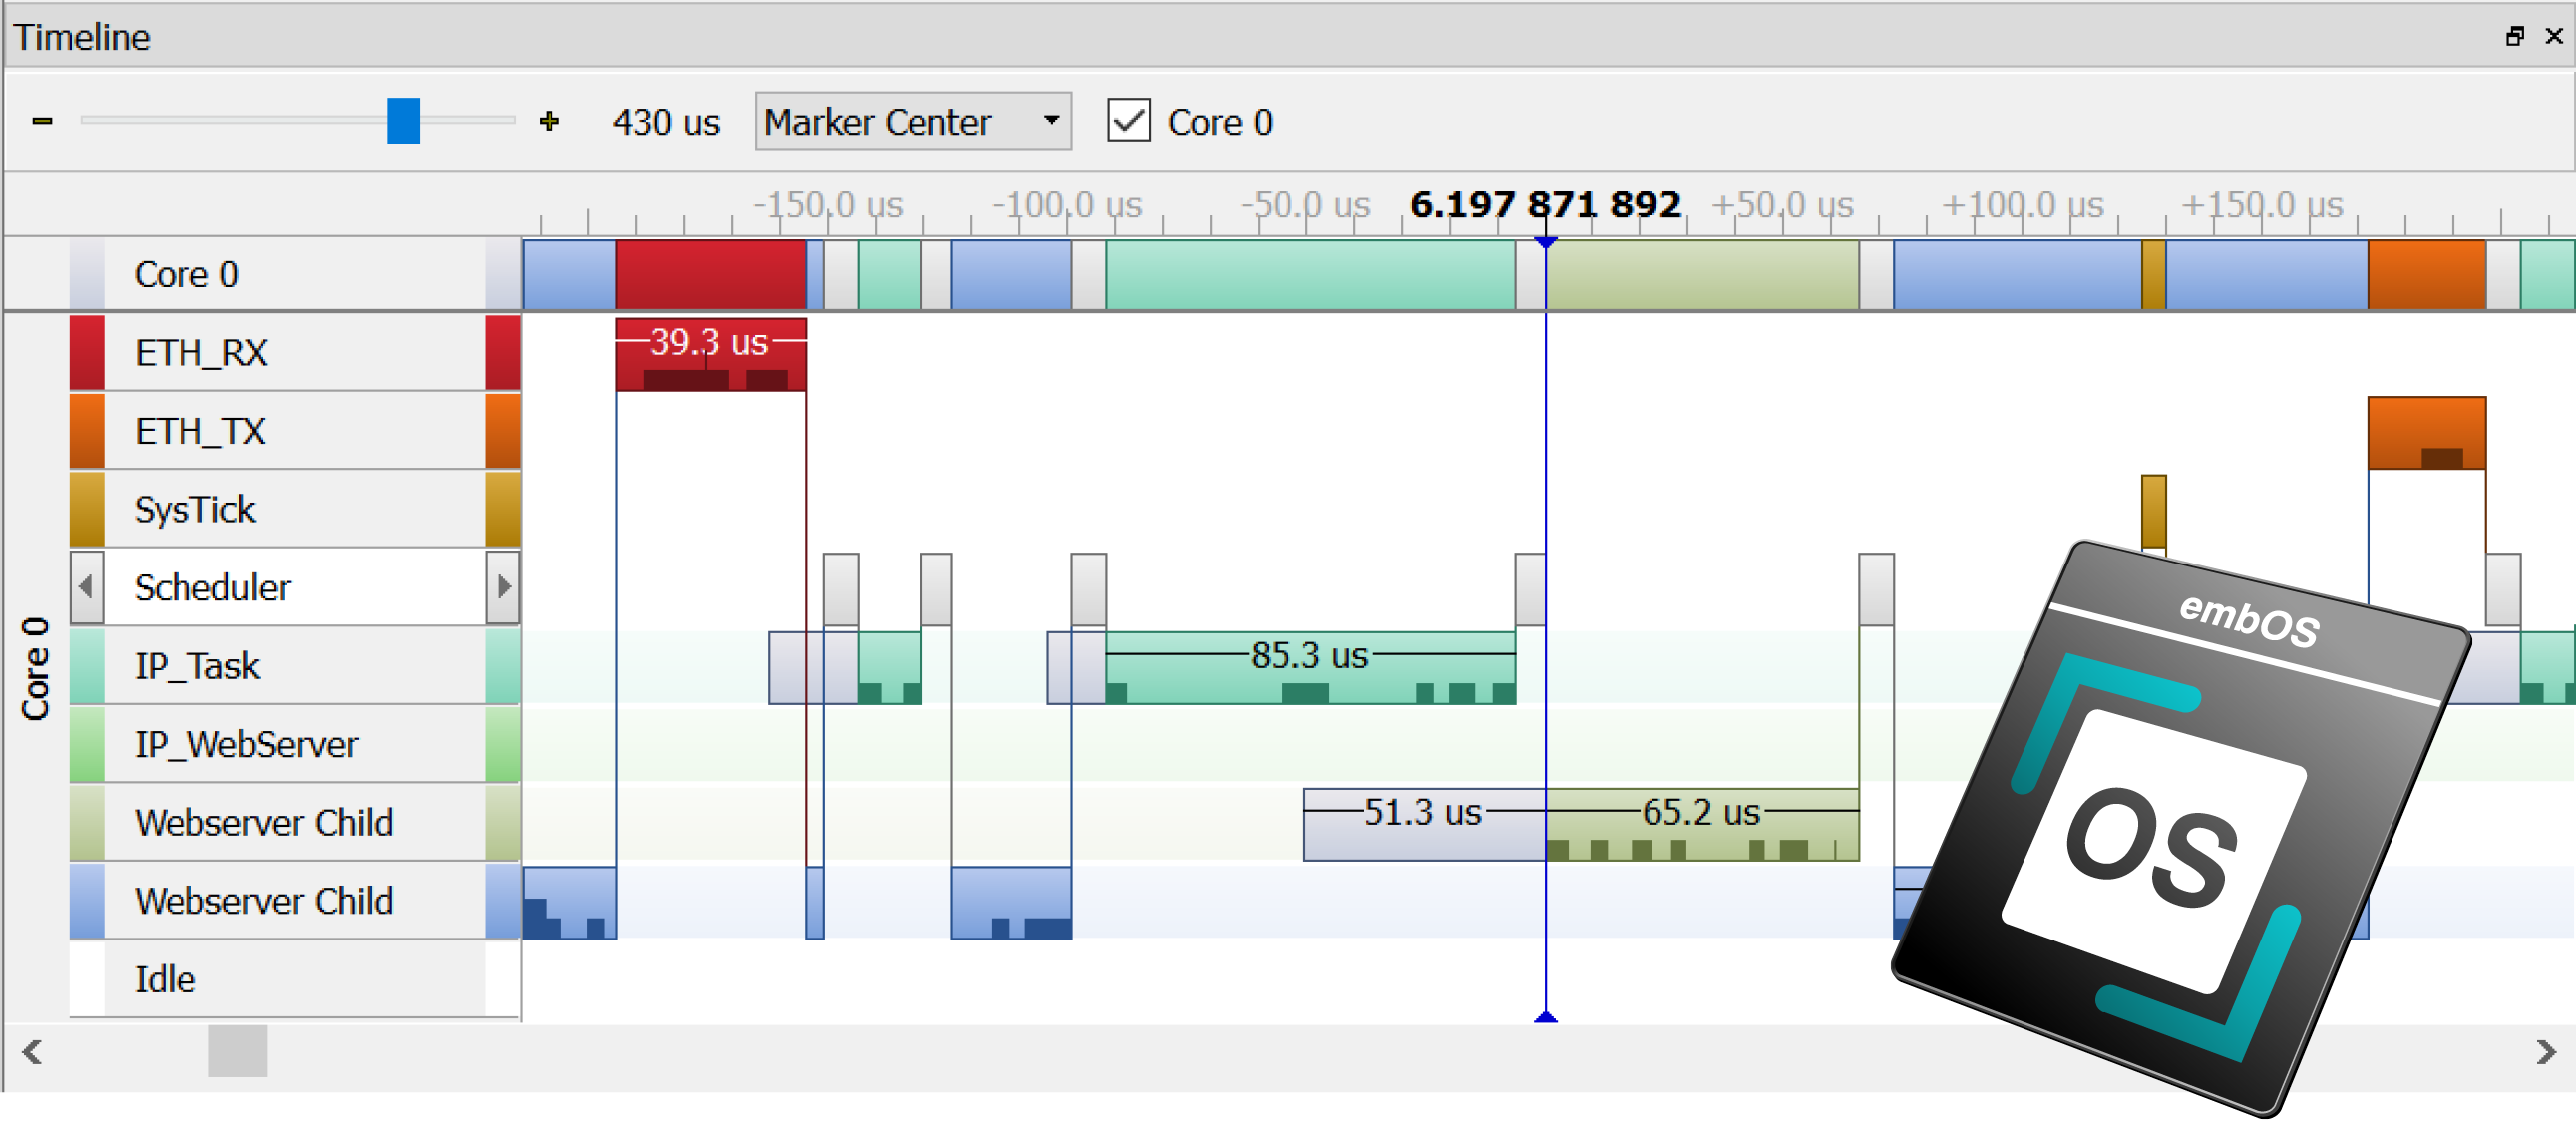
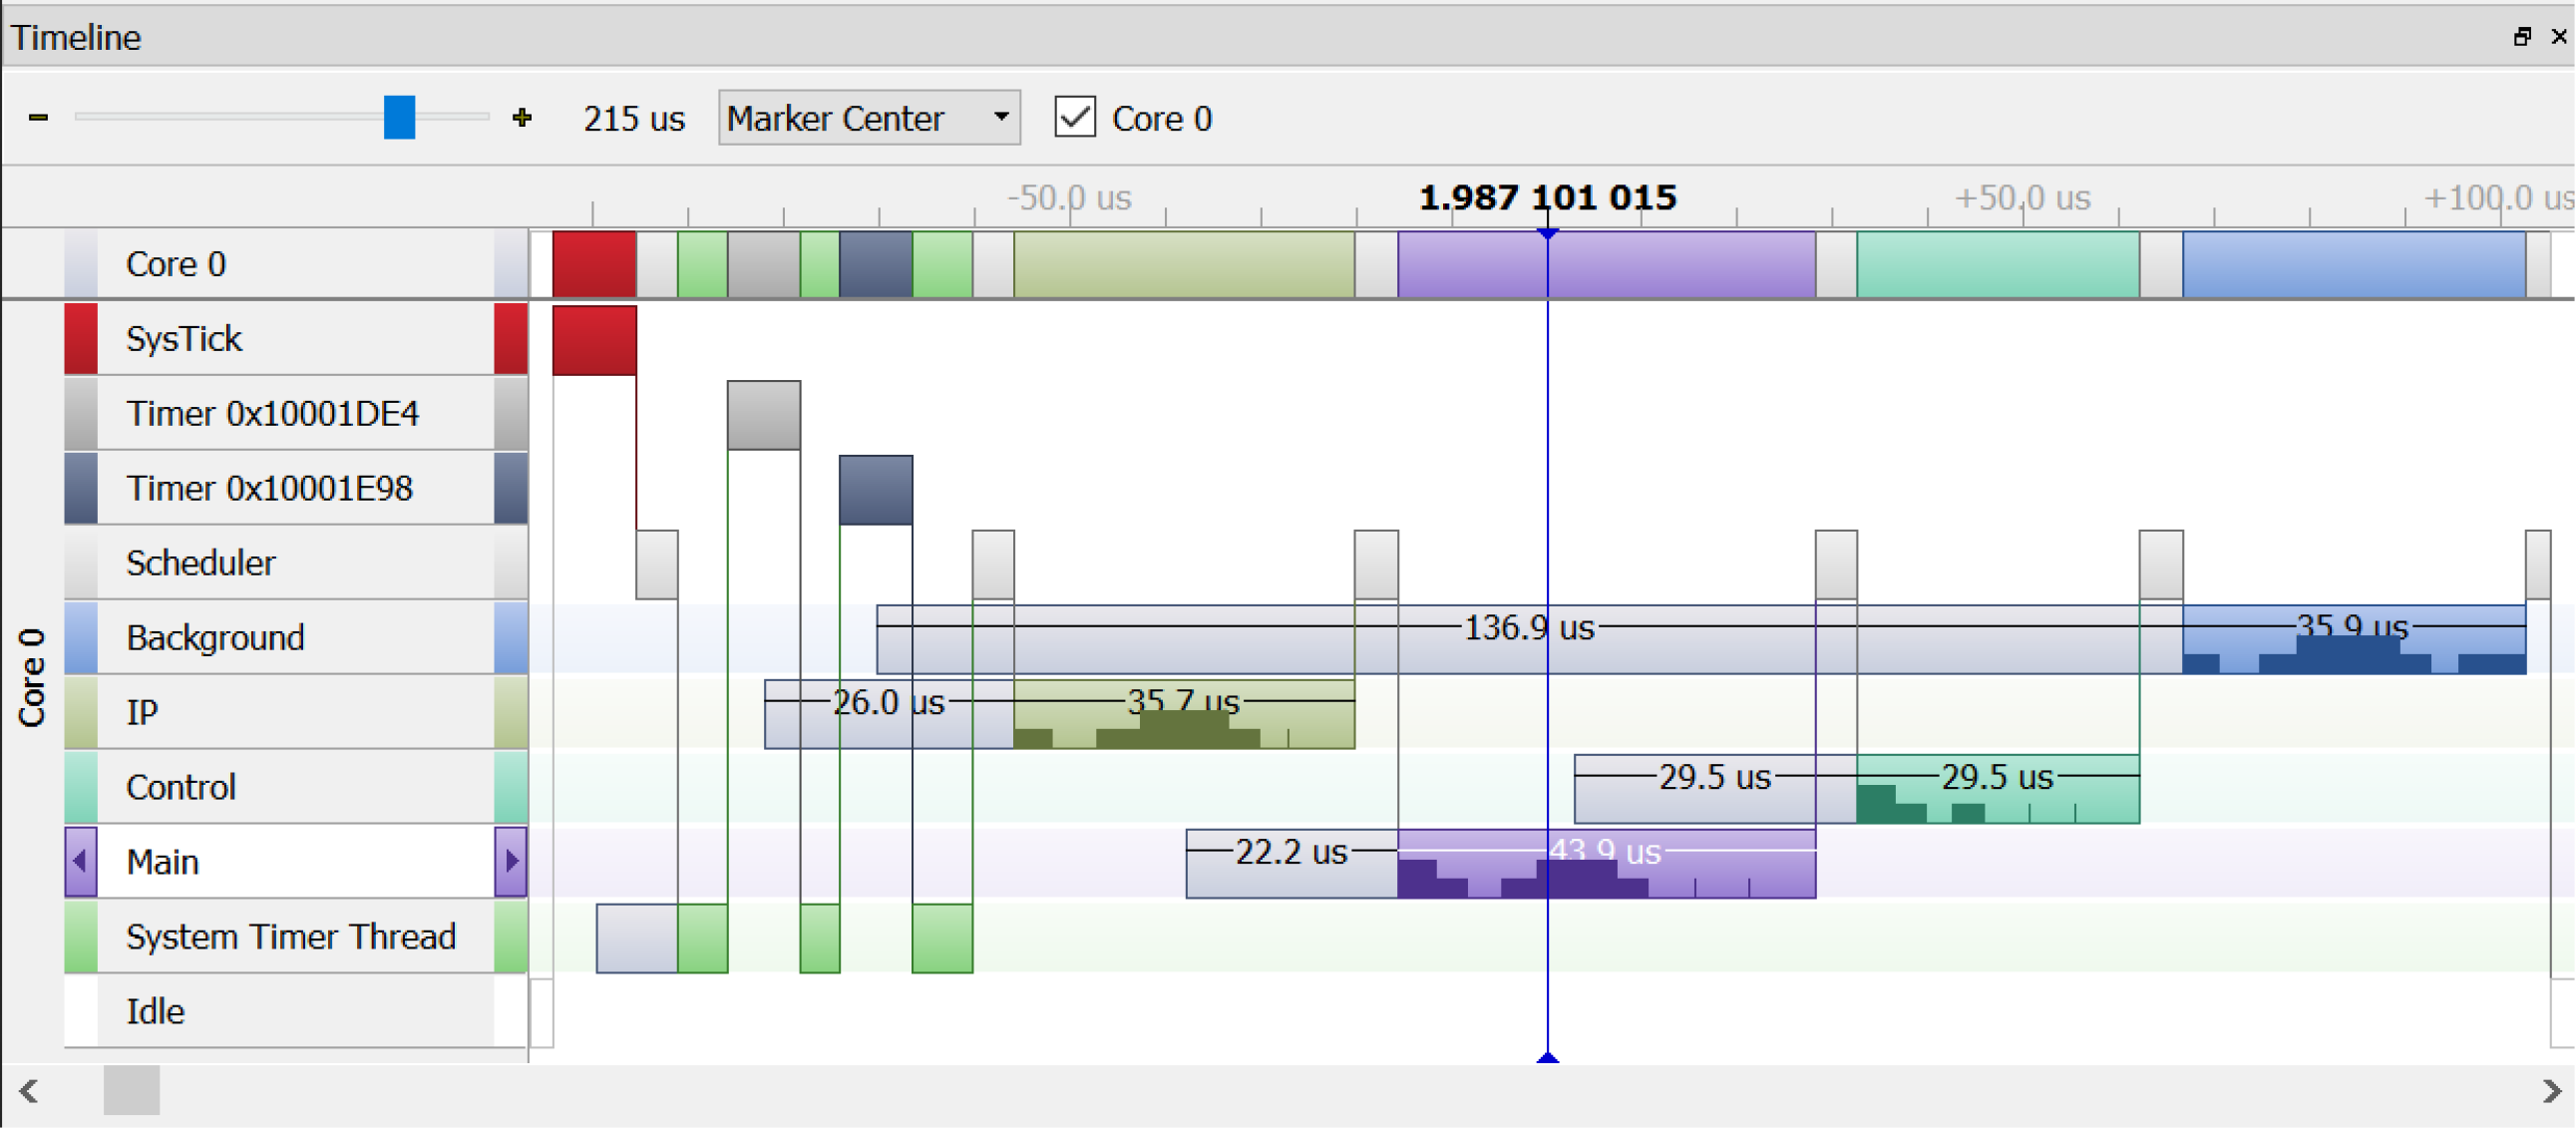
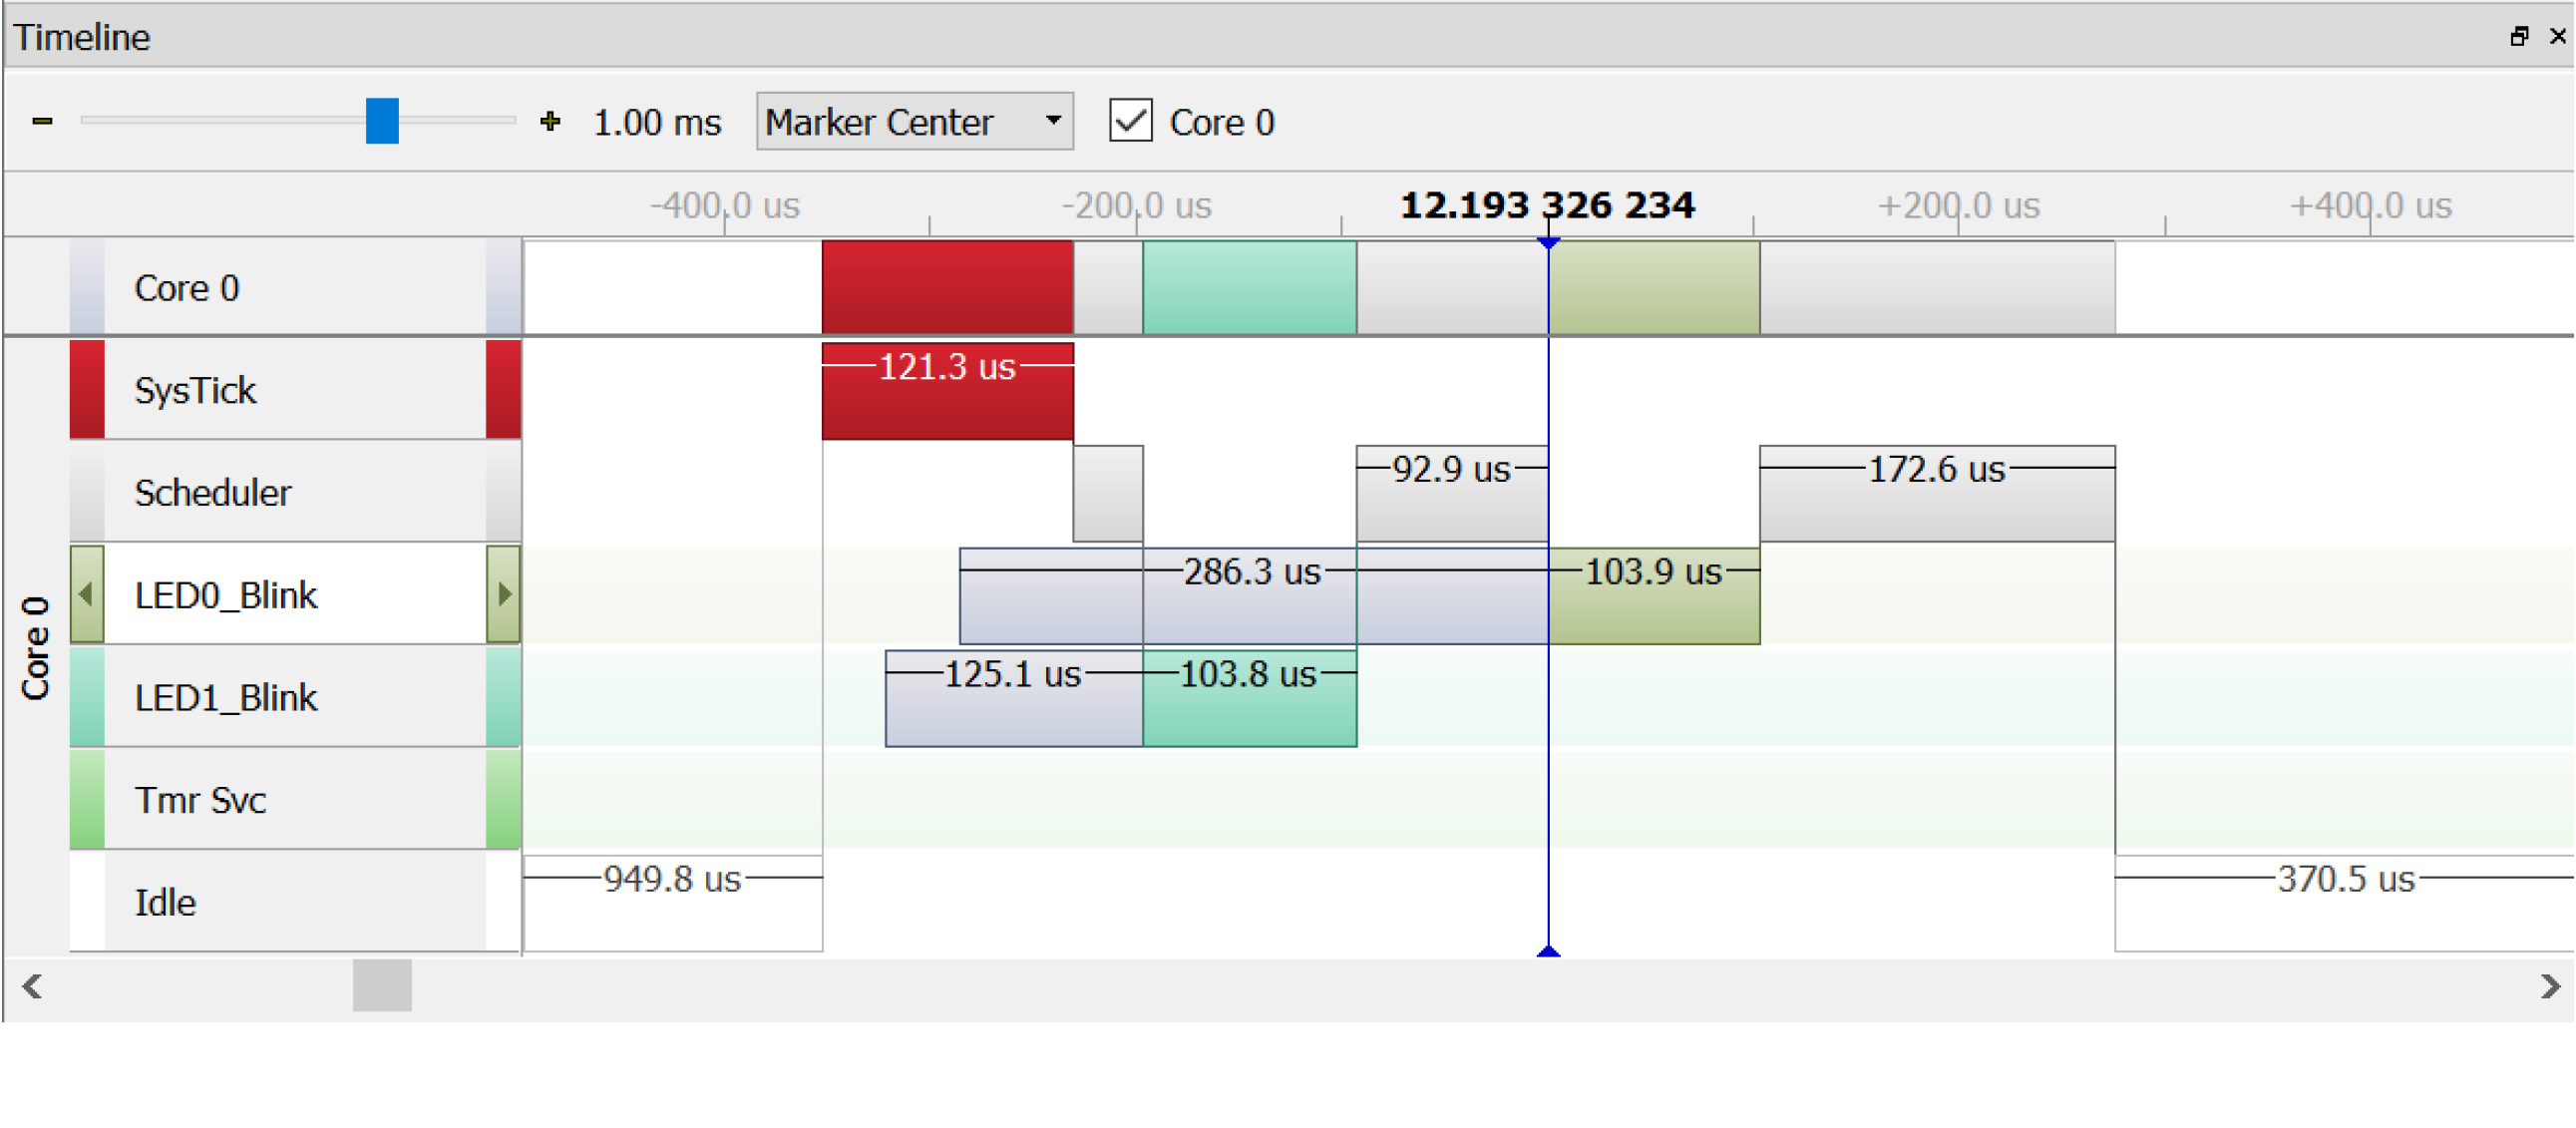
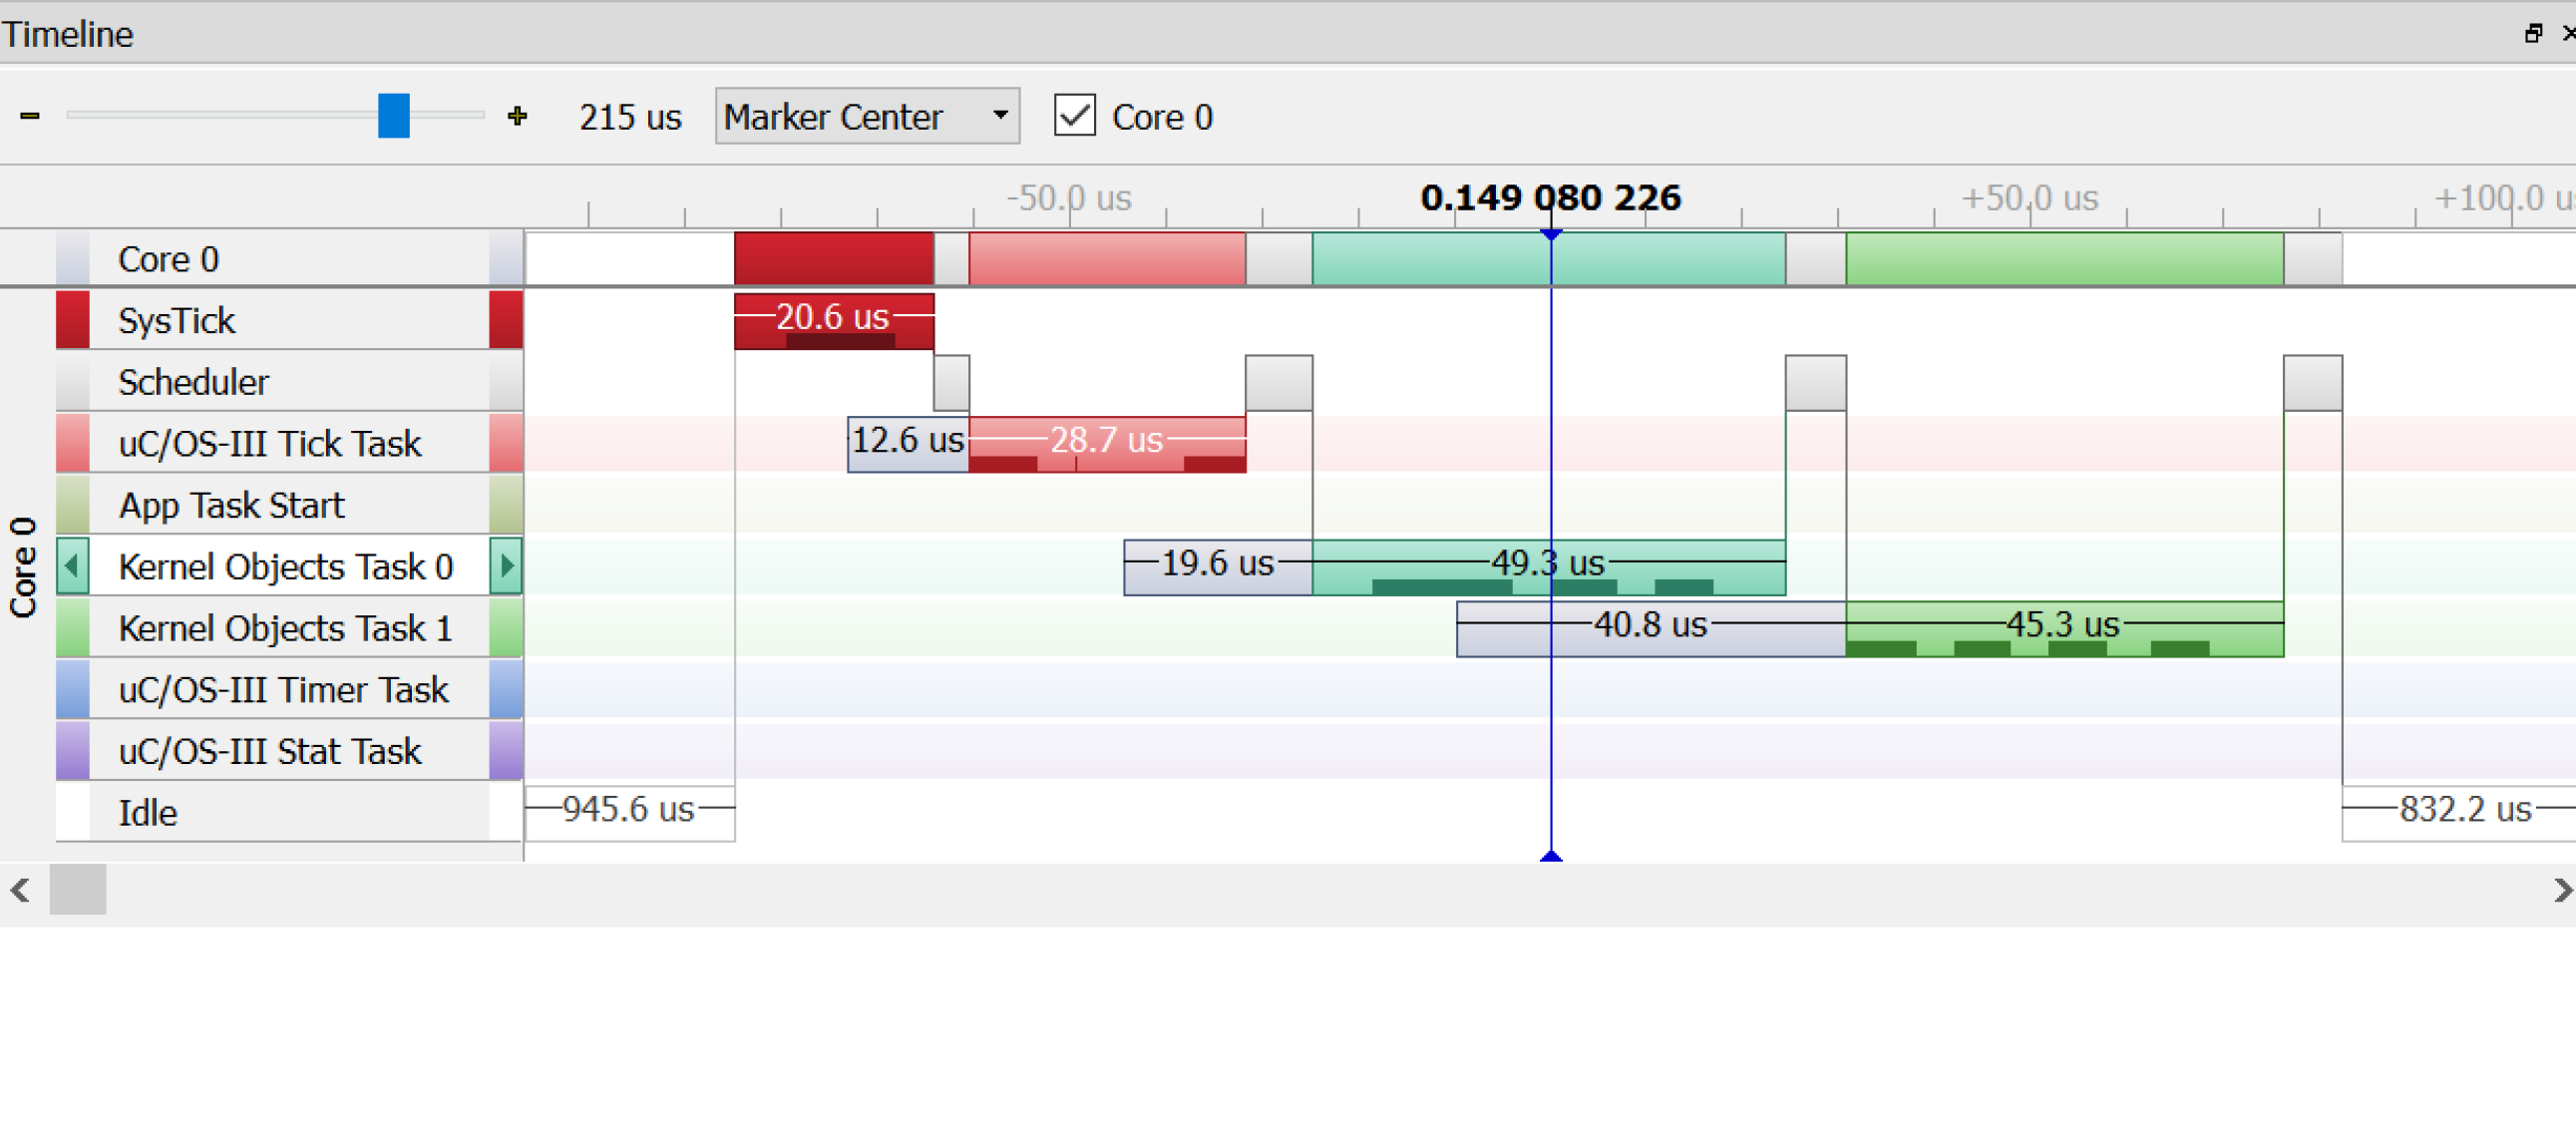
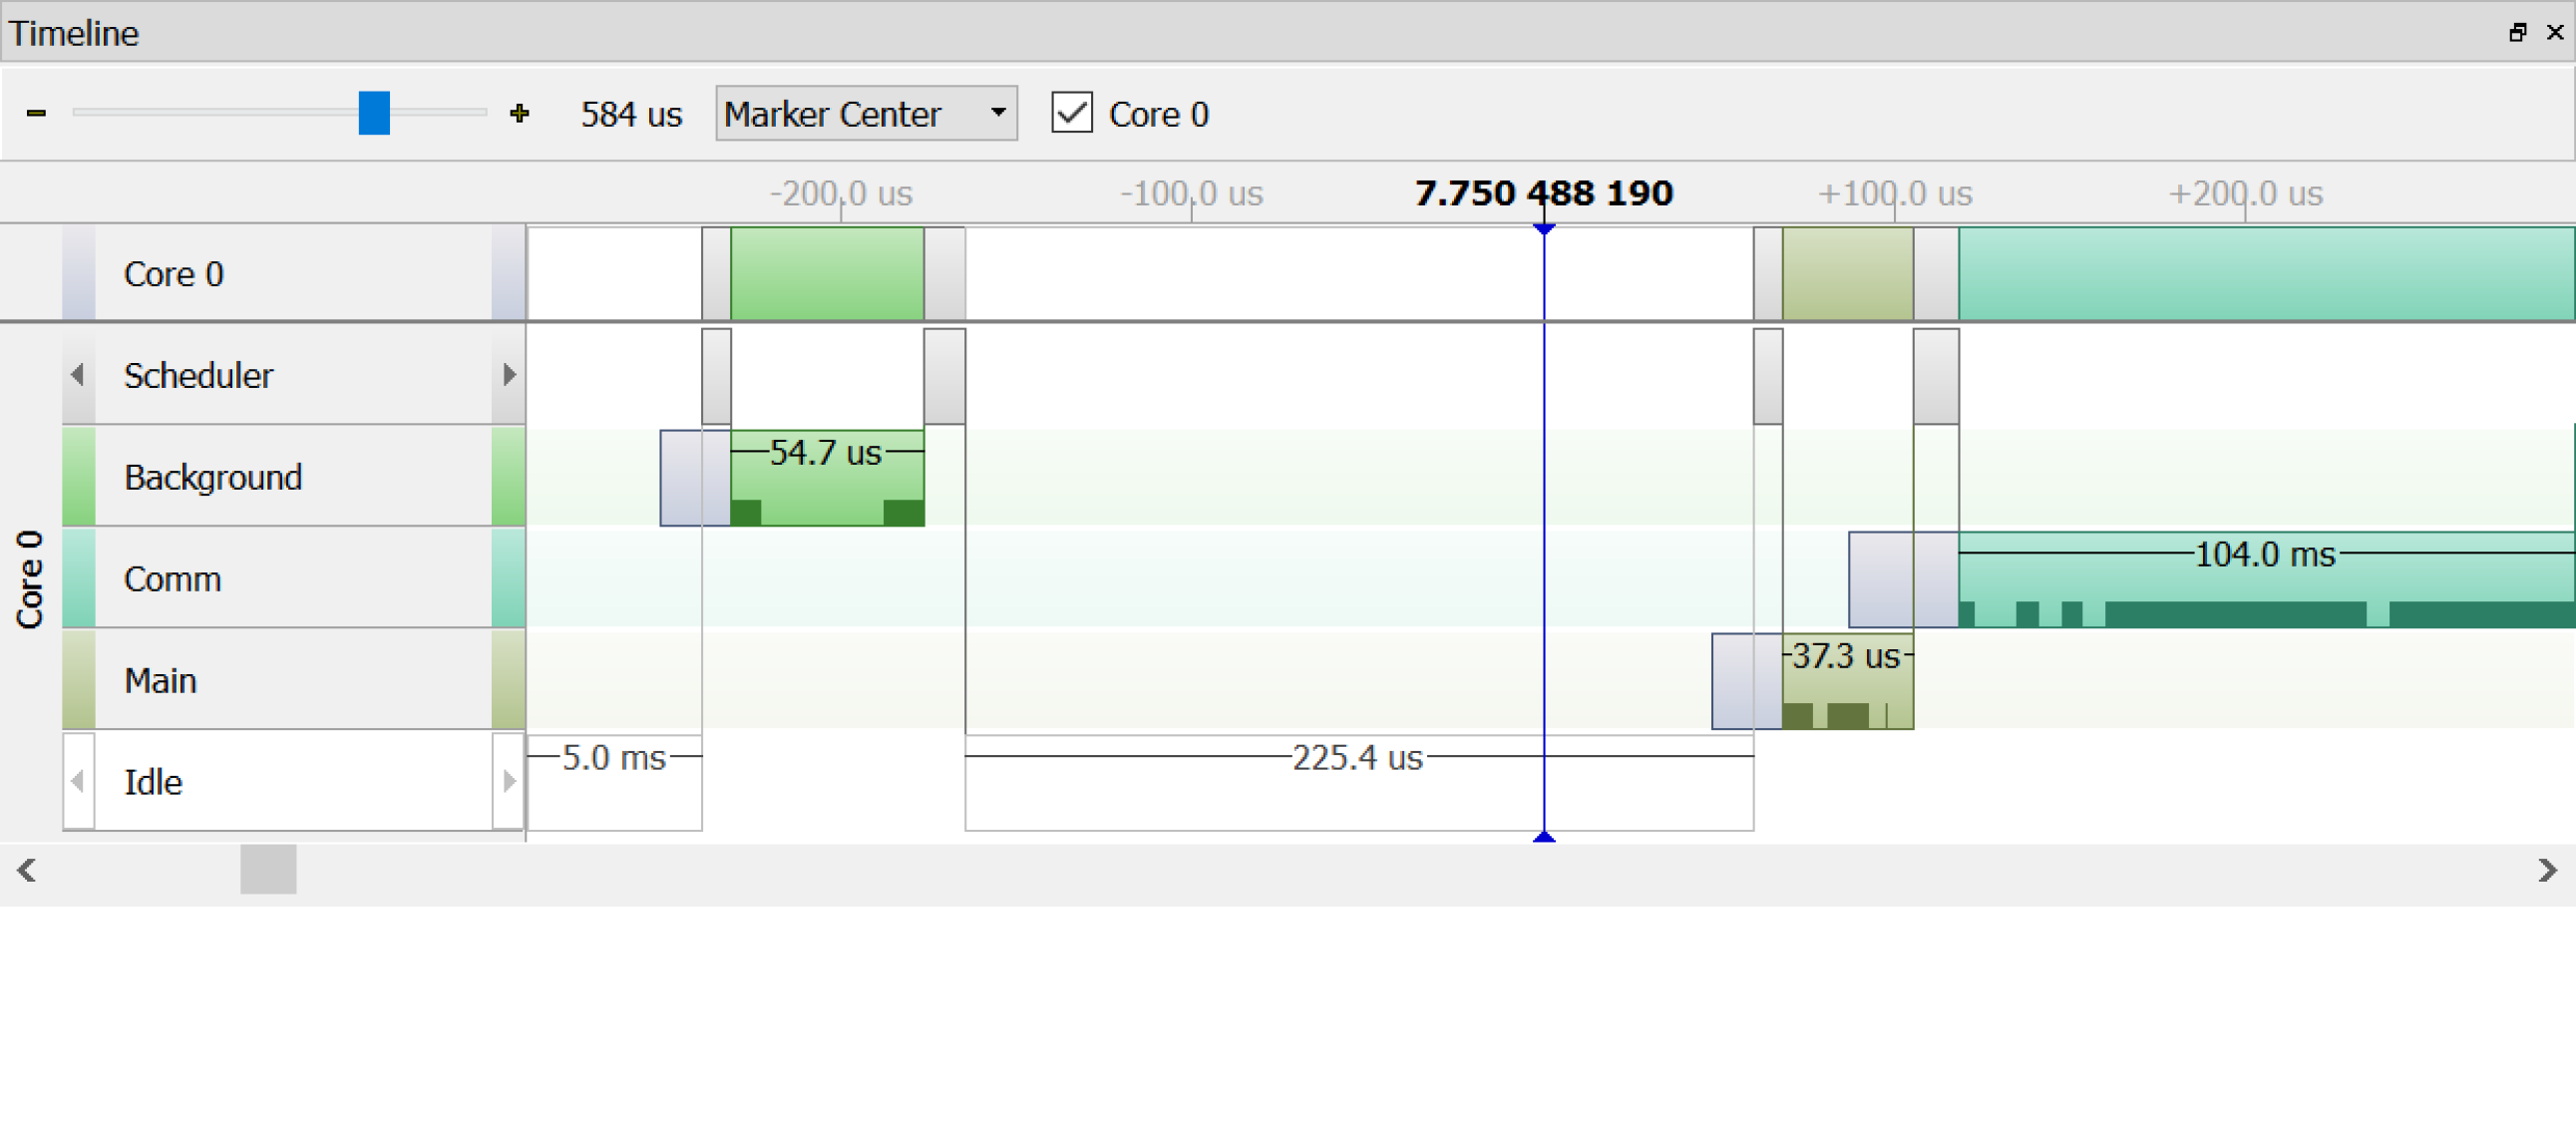
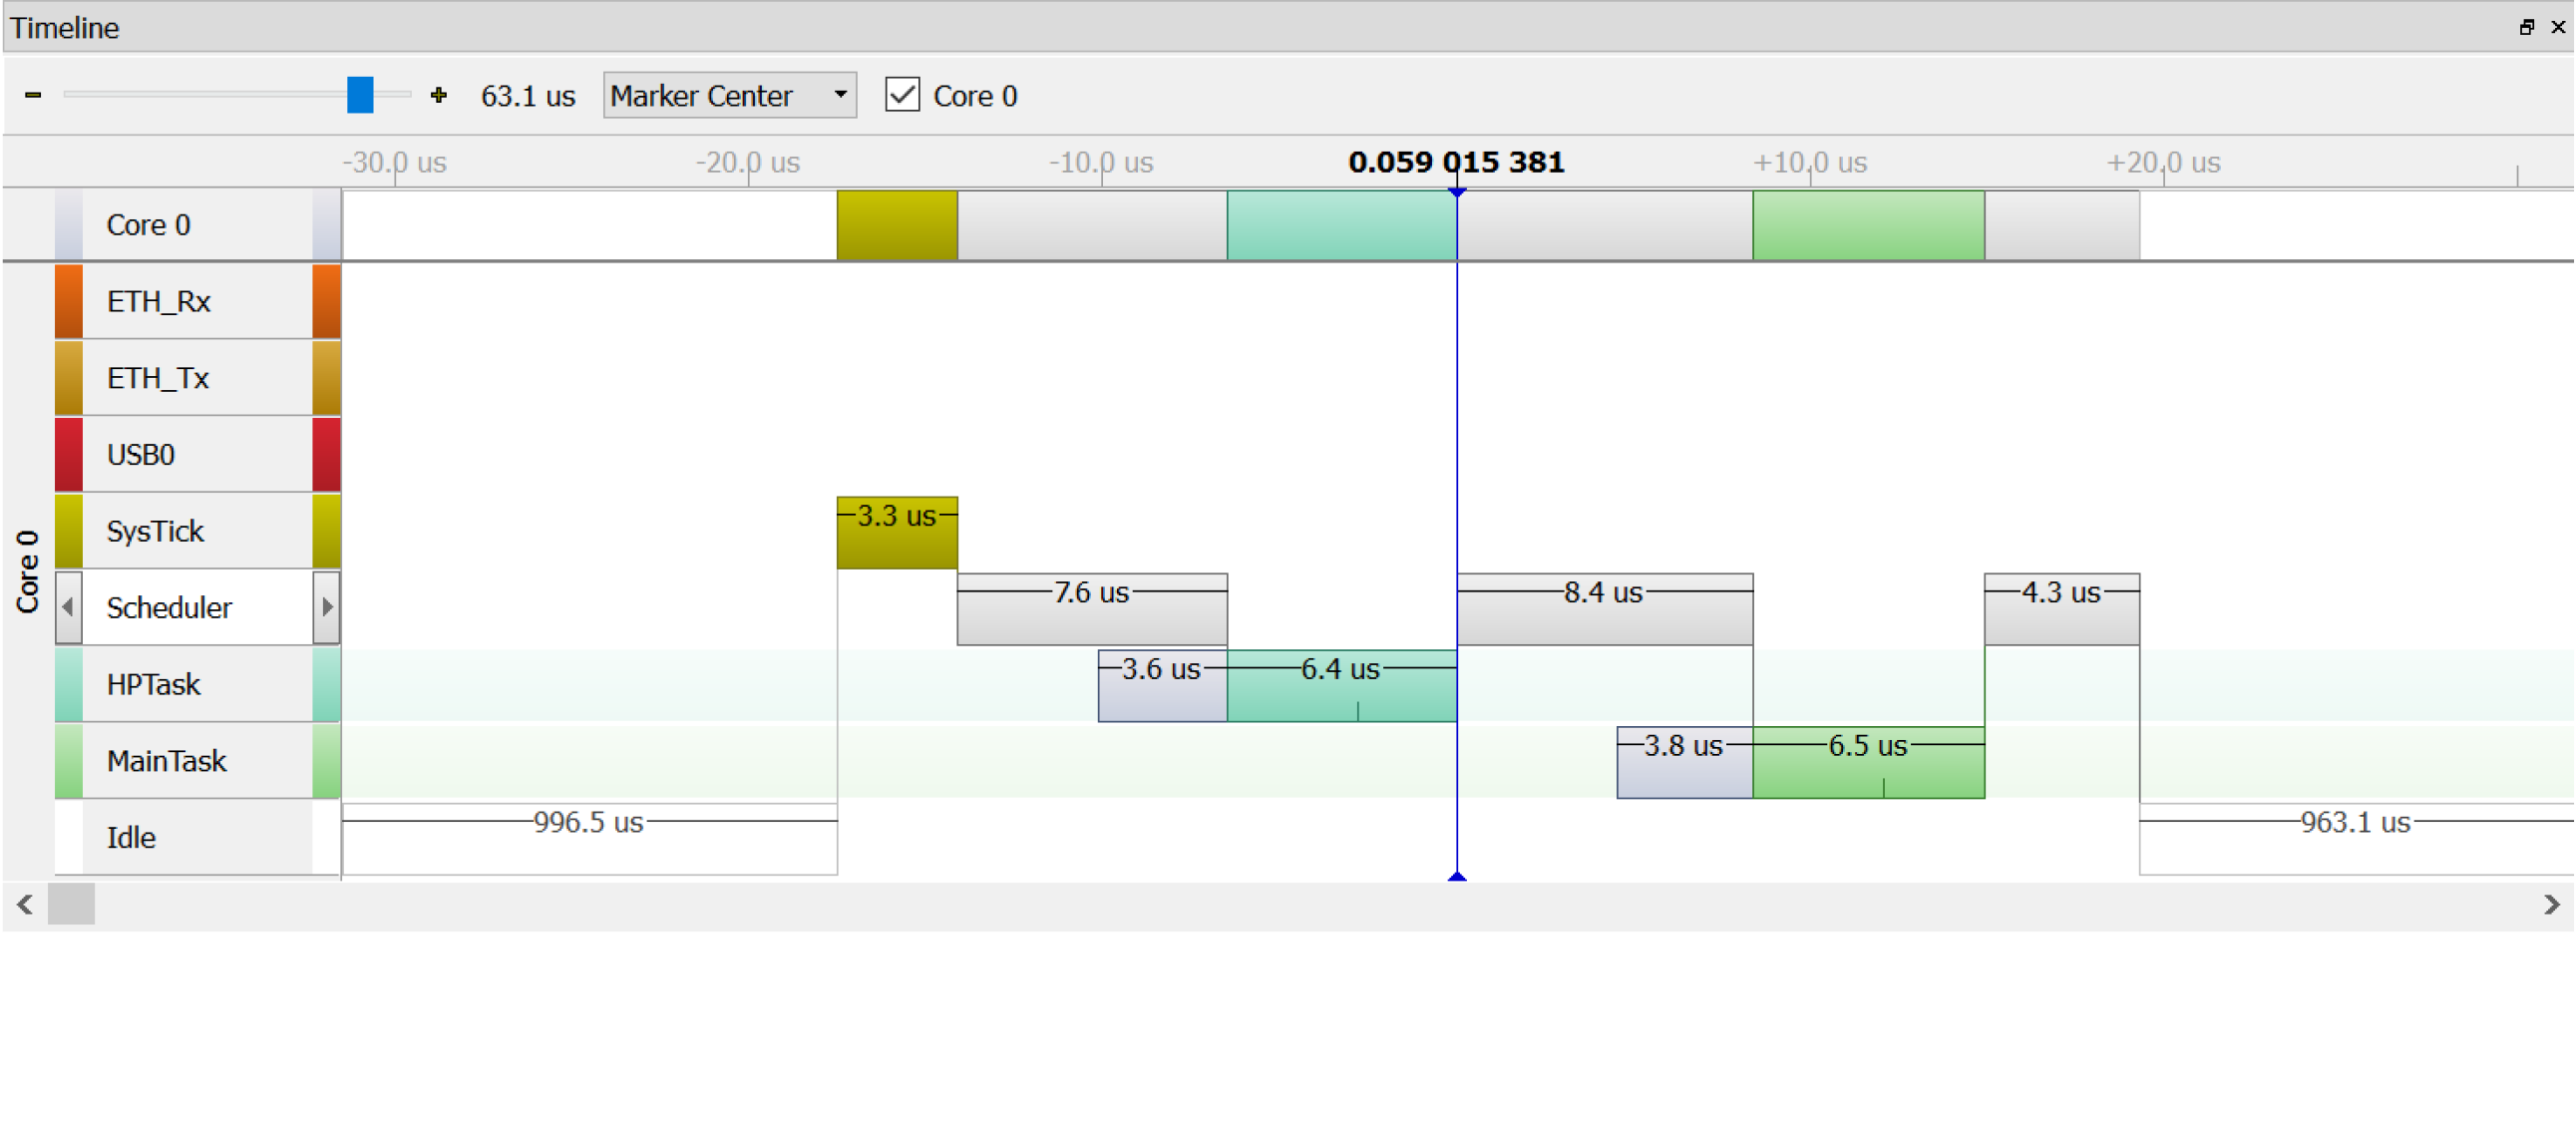
Event timeline window

Chronologically plots task switches, interrupt activity, and scheduling events. This visualization helps developers pinpoint inefficiencies, identify anomalies, and gain a clear understanding of runtime behavior across tasks and interrupts.
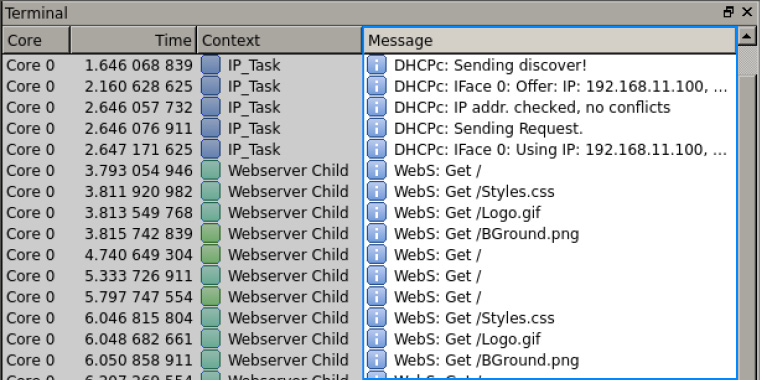
Logging output

Logs messages during recording, including warnings and errors, with formatting similar to printf(). To save time and resources, formatting is deferred to the SystemView application, which processes and displays the log data in its Terminal Window.
ELF-based analysis
SystemView makes use of ELF-file information to assign resource names and messages automatically. Longer text data does not need to be transmitted any more. This reduces ROM usage and RTT bandwidth and leads to faster, more efficient system analysis.
RTOS support
SystemView can be used out-of-the-box with RTOSs such as embOS, uC/OS-III, Micrium OS Kernel, FreeRTOS, NuttX, Zephyr, and ThreadX or even without any OS to record interrupt activity and user events.
embOS
SystemView support has been included in embOS since version 4.12a. It allows for the display and recording of application and operating-system execution. Any embOS library mode that includes the embOS trace API has SystemView support enabled by default. Additionally, embOS source code projects can be individually configured to enable SystemView support.
ThreadX
Eclipse ThreadX (formerly Azure RTOS) has been instrumented for use with SystemView since version 6.4.
FreeRTOS
SystemView can be used with versions V8, V9, V10, and V11. It is natively supported since FreeRTOS V11.
uC/OS
Micrium OS Kernel
SystemView can be used with Micrium OS Kernel since its first version.
Zephyr
SystemView has been integrated into Zephyr's tracing feature and can be used with all versions since 2019.
NuttX
System requirements
| Supported OS | |
|---|---|
| Windows | Microsoft Windows (x64/Arm) |
| macOS | macOS (x64/Apple Silicon) |
| Linux | Linux (x64/Arm) |
| Development system | |
|---|---|
| CPU | 2GHz |
| Memory | 4GB RAM |
| Disk space | 2GB |

Licensing
SystemView is available as a SEGGER Software Tool under SEGGER's Commercial-use License. Licenses for SystemView are perpetual, enabling you to use the tool indefinitely without requiring an annual subscription.
For non-commercial use, evaluation, and educational purposes, the software is provided under SEGGER's Friendly License.
Silicon vendor buyouts
SEGGER offers the option to license SystemView for redistribution to company customers on a company's own terms. A free commercial license may be used to develop applications for certain devices from a silicon vendor. Free licenses can be activated easily through the license-request dialog.
FAQ
Can I use SystemView while debugging my application?
Yes. SystemView can run in parallel with a debugger and perform continuous recording. To ensure that data can be read fast enough, configure the debugger connection to use a high interface speed (≥ 4 MHz). Parallel connections to a target are currently supported only on Windows and Linux.
Can I use SystemView with my old J-Link?
Yes. SystemView can generally be used with any J-Link that supports the target core. Older J-Links (V8 and earlier) may have limited RTT capabilities, which can result in overflow events if the RTT buffer cannot be read fast enough while many events are generated. Information about trade-in or upgrade options can be found in the purchase section.
Can I do continuous recording on Cortex-A or Cortex-R devices?
This depends on the target device. RTT requires memory access while the target is running. On Cortex-A and Cortex-R devices, this is performed via the AHB-AP. If the device provides an AHB-AP, continuous recording with SystemView is possible.
Can I do continuous recording on ARM7 or ARM9 devices?
No. RTT requires memory access while the target is running. On ARM7 and ARM9 devices, only single-shot and post-mortem recording modes are supported.
I do not use embOS or FreeRTOS. Can I still use SystemView?
Yes. SystemView can be used with any RTOS. For task and OS execution recording, the operating system must provide hooks or trace instrumentation that SystemView can integrate with. Otherwise, the OS must be instrumented manually. If this is not possible, SystemView can still be used to record interrupt activity and user-defined events.
I do not use any operating system at all. Should I still use SystemView?
Yes. Even without an operating system, SystemView can record interrupt activity, verify that interrupts occur as expected, and record user events that can be used to measure module execution times.
I get overflow events during continuous recording. How can I prevent this?
Overflow events occur when the SystemView RTT buffer becomes full. This can happen for several reasons:
- J-Link is busy due to debugger activity and cannot read data fast enough.
- The target interface speed is too low.
- The application generates more events than fit into the buffer.
To reduce the likelihood of overflow events:
- Minimize debugger interaction while the target is running, for example by disabling live watches.
- Select a higher interface speed for all tools connected to J-Link, including the debugger and SystemView.
- Increase the size of the SystemView buffer (1 to 4 kByte).
- Run SystemView in stand-alone mode without a debugger.
My application crashes when I connect SystemView. What might be the reason?
Ensure that approximately 200 bytes of stack space are available for SystemView in every context that can generate SystemView events, including tasks, interrupts, and the scheduler.
I cannot start recording in SystemView. What might be wrong?
Possible reasons include:
- J-Link or the target is not connected. Verify that all connections are correct.
- The target is not running. If the target is stopped, the RTT Control Block may not be found.
- The SystemView module is not configured. Ensure that the SystemView module is included in the application and that
SEGGER_SYSVIEW_Conf()is called during startup. - The J-Link Software is outdated. Make sure the latest J-Link Software and Documentation Package is installed.
SystemView cannot find the RTT Control Block. How can this be configured?
Automatic detection of the RTT Control Block is only possible within a known RAM address range after initialization. Ensure that application startup has completed before starting a recording. If the RTT Control Block is located outside the known range for the selected device, select Address and enter the exact address, or select Address Range and specify a range that contains the RTT Control Block.
I receive invalid packets. Why does this happen?
Invalid packets are typically generated by the target system for one of the following reasons:
- SystemView does not correctly lock while recording an event and is interrupted by another event. In this case, verify that
SEGGER_SYSVIEW_LOCK()andSEGGER_RTT_LOCK()are configured correctly for the device. - The system enters sleep or low-power mode, preventing J-Link from reliably accessing RAM. It is recommended not to use WFI or other low-power modes while a debug probe is connected.
Do I have to select a target device to start recording?
Yes. J-Link must know which target device is connected. The drop-down list shows the most recently used devices. To select another device, simply enter its name. A list of supported devices is available in the device selection dialog.
Latest news
Related content
Get in touch with us
Have questions or need assistance? Our Embedded Experts are here to help!
Reach out to us for:
- Licensing quotes
- Technical inquiries
- Project support