DataPlot window
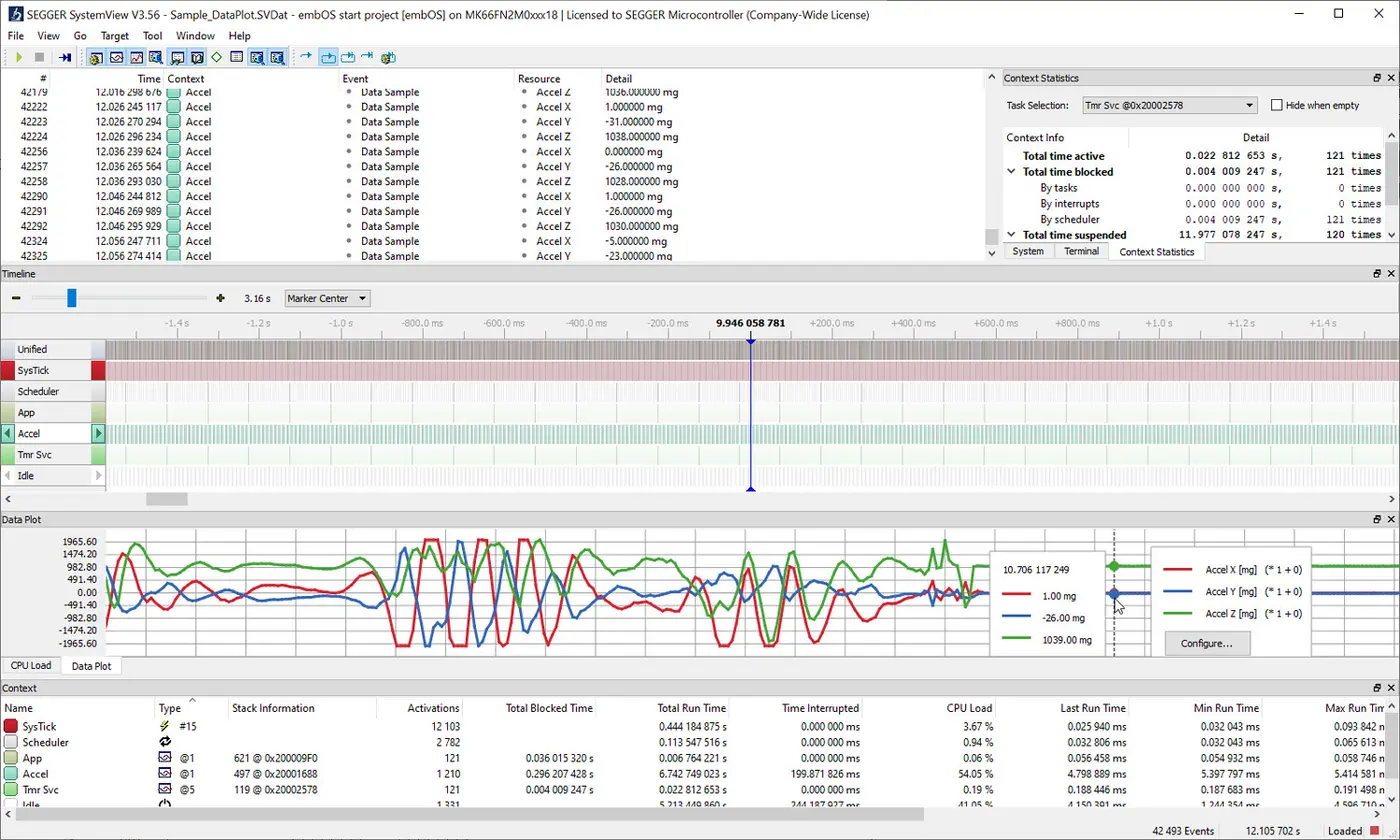
Visualize recorded embedded system data in oscilloscope-style graphs, synchronized with SystemView's Timeline and CPU Load windows for a comprehensive view on runtime behavior.

Overview
When analyzing system runtime behavior, inspection of variable data is essential for fully understanding how an embedded system works. The DataPlot window, SystemView's data recording feature, enables users to record variable data alongside runtime events. Its seamless integration with SystemView facilitates an in-depth and detailed analysis of the embedded system's recorded data.
The primary focus of the DataPlot window is to provide a trace of each measurement over time, with at-a-glance verification or diagnosis of system responses, which ultimately assists in verifying system behavior and pinpointing events that cause unwanted behavior.
SystemView lets users plot multiple datasets simultaneously. A legend shows all registered data as well as the color associated with each plot. For easier identification, each dataset has a user-defined name. The value range is automatically calculated, ensuring that users can always see all data. Furthermore, users can define a fixed data range, if preferred.
Use case
Whenever an embedded system monitors power consumption, the DataPlot window becomes an essential tool for developers. By recording measured power samples in real time, SystemView enables seamless visualization of this data within the DataPlot window. By instantly synchronizing these plots with information on runtime behavior, developers can identify specific power spikes or increases in power usage along with the part of the system or function that caused them.
Configuration
The DataPlot window provides various options for adjusting how data is displayed. Configuration is done directly within SystemView, without affecting the target device. This means that the configuration can be changed during or after recording.
Users can choose from three display types: Discrete, Continuous, and Points. The display type can be changed at any time using the context menu.
When working with multiple data plots, the values may vary across different ranges. In such cases, the data can be shifted and scaled, enabling users to view entirely different datasets simultaneously. The legend provides an overview of the offset and scaling factors for all data, ensuring that users can easily track these adjustments.
Analyzing data
The mouse-over annotation feature allows users to view the value of sampled data at any point during the recording, including the exact timestamp.
Users can not only analyze the sampled data independently, but also place it in the context of the entire system. The DataPlot window synchronizes with all other SystemView windows, facilitating comprehensive embedded system trace analysis and helping to uncover unintended dependencies.
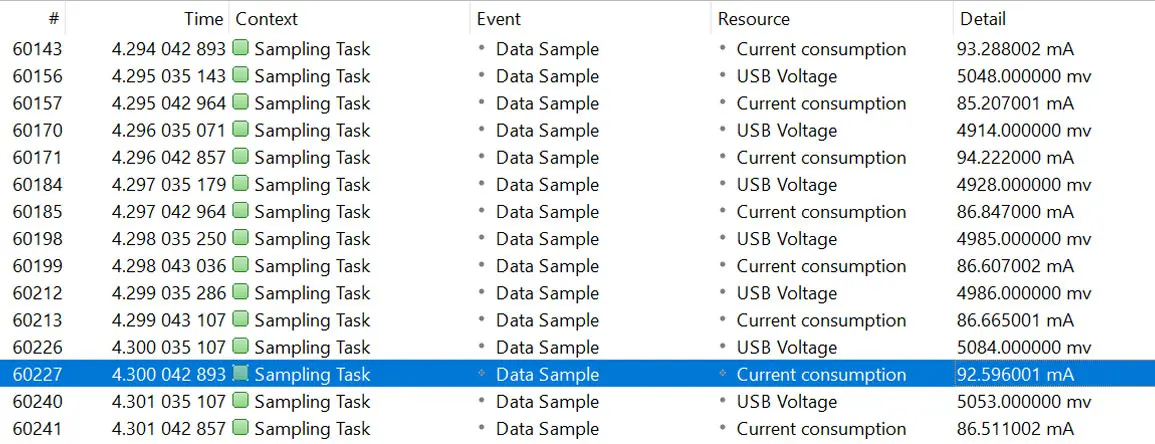
All data plot events are also displayed in the Events window, where more detailed information, such as the exact timestamp and sampled value, is available. As with other features in SystemView, these events can be exported for further processing.
Instrumenting source code
Once the data has been registered using SEGGER_SYSVIEW_RegisterData(), it can be sampled using SEGGER_SYSVIEW_SampleData(). The register event is used to send static information (such as name, unit, etc.) only once at the beginning of the recording. This way, SEGGER_SYSVIEW_SampleData() only needs to send the sampled data along with the corresponding ID. SystemView accepts fixed and floating point data.
Get in touch with us
Have questions or need assistance? Our Embedded Experts are here to help!
Reach out to us for:
- Licensing quotes
- Technical inquiries
- Project support


