Control panel
Gives full insight in real time of what J-Link is currently doing and can be used to extend the feature set of J-Link, without even touching the IDE. It is available on all models (even small J-Link OBs and models without Ethernet).
Overview
The J-Link control panel extends the feature set of J-Link by giving the user full insight of what J-Link is currently doing. By the different tabs, it provides plenty of information about various things that make the debugging life easier and more transparent.
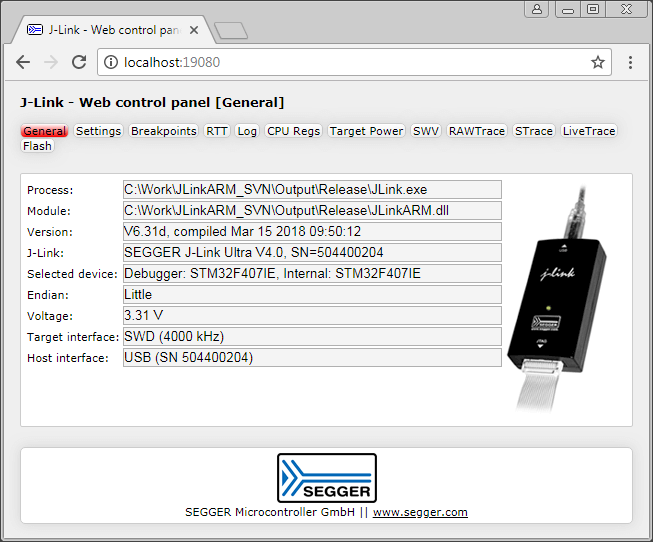
The J-Link control panel is available as soon as the debug session has been started. It can be accessed by typing localhost:19080 into the address line of the web browser (all popular web browsers are supported). The J-Link control panel is available on all platforms (Windows, Linux, macOS).
The J-Link control panel is based on SEGGER's emWeb web server which is available as a separate product.
Extending the IDE feature set
Who does not know it? An IDE has been chosen and working with it is started. Then, a new, very useful feature is introduced in the J-Link software but the IDE has not adapted it yet. Or even worse, the IDE cannot be updated due to certification reasons. The J-Link control panel provides the opportunity to make use of new J-Link features without even touching the IDE itself. As the J-Link control panel is not bound to the IDE in any way, updates can be provided independent from the IDE being used.
Information about J-Link and debug session
The J-Link control panel provides information about the J-Link (model, S/N, host connection, interface speed, ...) as well as information about the debug session (what process has started the debug session, which version of the J-Link software has been loaded, ...)
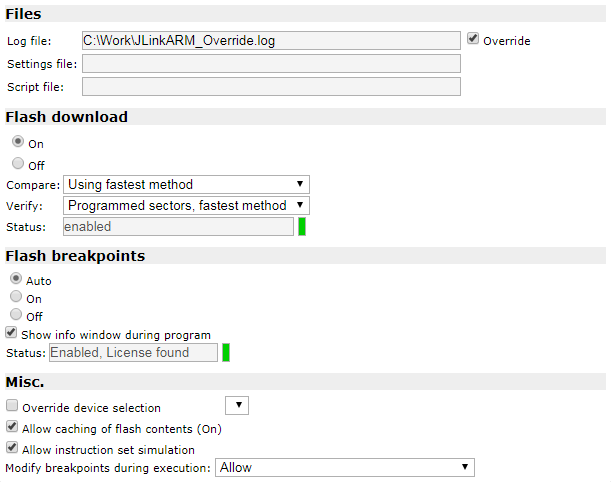
Configuring J-Link
The J-Link control panel allows easy configuration of J-Link, be it general configuration like enable/disable supply power to the target, or debug session specific configuration like enabling/disabling flash download, status dialogs etc.
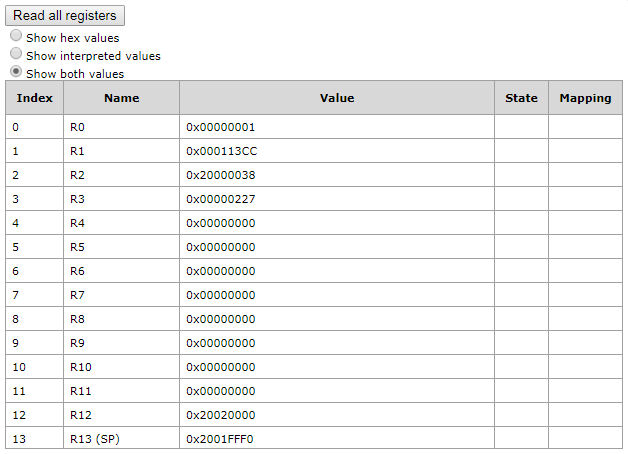
Watching CPU registers
The J-Link control panel provides a view to the current CPU register values. This may also include CPU registers that are not even available through the IDE that is currently used.
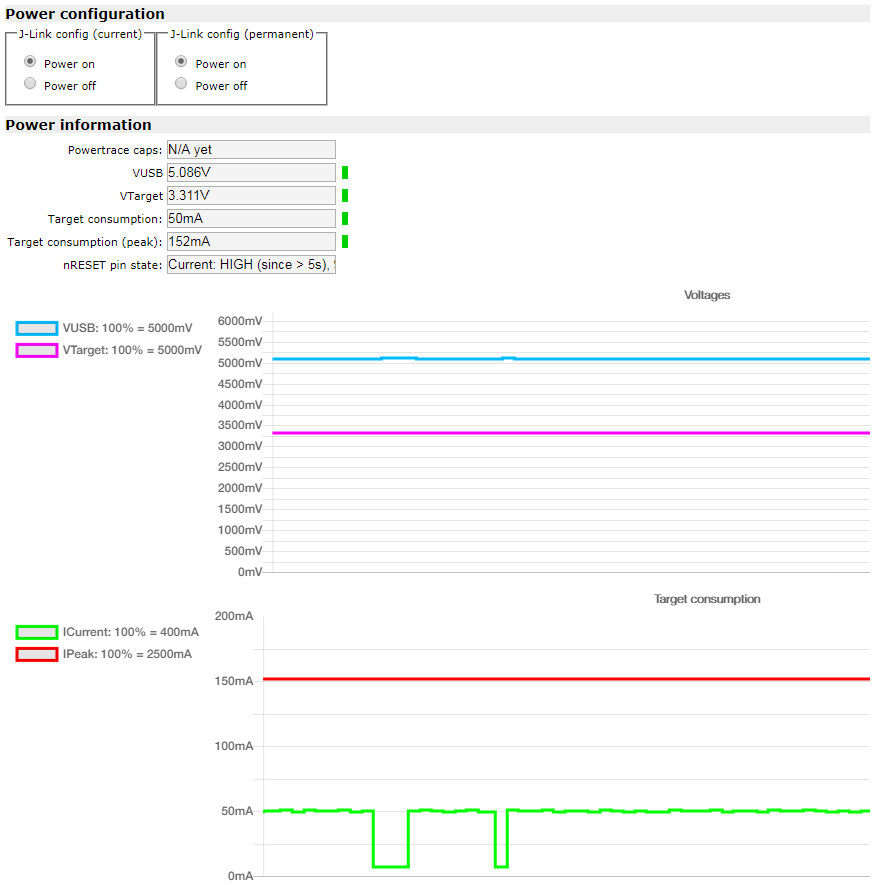
Monitoring target power consumption
The J-Link control panel provides information about the current power consumption (if J-Link supplies power to the target) of the target system that is debugged. This information is presented in a graph and updated live.
Note: This feature is only available on high-end models like J-Link Ultra and J-Link Pro. See Model comparison.