Thread Aware Debugging
J-Link GDB Server
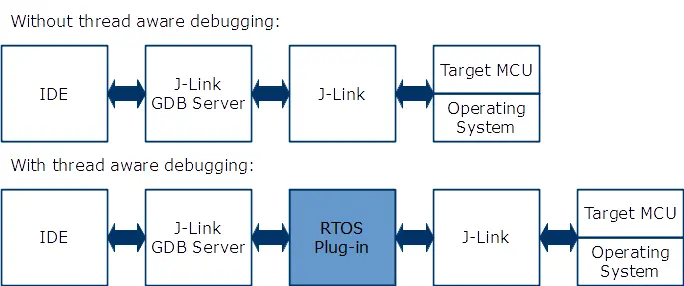
Most embedded systems nowadays make use of a real-time-operating system (RTOS). For these systems thread aware debugging is a very useful feature. J-Link GDB Server supports thread aware debugging via a plugin system.
What is Thread Aware Debugging
By default, when halting a target system in the debugger, the current registers (program counter, stackpointer etc.) as well as the current call-stack are shown. When running an RTOS, most of the time, the system will be in Idle / the Idle task. So the chance is fairly high that, when halting the system, it will be in Idle and not not much information is gained by seeing the current registers and callstack.
Thread aware debugging specifies the capability of a debugger to show all existing threads / tasks of the RTOS, running on the embedded system when the target system is halted by the debugger. It further allows to select a specific task (suspended or not does not matter) in the IDE and for example by double-clicking showing the current CPU registers as well as the call stack of that task.

The GDB Server plugin interface
By default, J-Link GDB Server does not know about the RTOS running on the target system and therefore it cannot provide thread specific information that would enable thread aware debugging. For this, an optional plugin for a specific target RTOS (a DLL under Windows and shared library under Linux and macOS) can be specified to be loaded, when starting J-Link GDB Server. This way, when halting the target system, the debugger (GDB based environment) will request information about the number of threads that currently exist. As the plugin knows about the structure of the RTOS, it can provide this information to J-Link GDB Server which then can provide it to the IDE.
Which IDEs are supported for thread aware debugging?
In general, thread aware debugging should work with any Eclipse + GDB based environment that uses J-Link GDB Server for debugging. So far, it has been tested with the following IDEs:
- NXP Kinetis Design Studio
- Atollic TrueSTUDIO
- ARM DS-5 Development Studio
What RTOSes are supported?
Currently, SEGGER provides plugins for thread aware debugging for Cortex-M architecture and the following RTOSes:
- SEGGER embOS (V4.20 or newer)
- FreeRTOS (V8.0.0 or newer)
The plugins are part of the J-Link Software and Documentation pack. For more information on how to use a plugin, please refer to UM08001, chapter "J-Link GDB Server".
How to support new / further RTOSes?
Support for another RTOS can be added by creating a plugin for that RTOS via the J-Link GDB Server RTOS plugin SDK which is available from SEGGER upon request. The SDK includes a source template and the source of our embOS plugin as well as a documentation to the J-Link GDB Server's plugin API.