- J-Link
SEGGER introduces J-Scope, data visualization for J-Link
J-Scope is based on the newly introduced J-Link HSS (High Speed Sampling) feature, which makes it possible to continuously sample variables at extremely high speeds without affecting the real-time nature of the embedded device. Using the standard debug interface, it does not require any extra resources on the target such as memory, CPU time or extra pins.
The periodic sampling is done autonomously by the J-Link. This allows considerably higher sampling rates and more precise timing than other debug probes. J- Scope uses this feature to read the target variable data and display both the value and an oscilloscope-like trace.
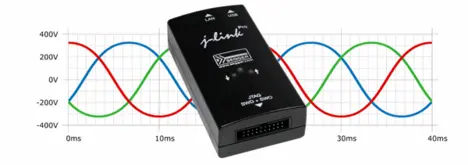
Examples of where HSS and J-Scope can be used is in monitoring network stack loads, or monitoring a 3-phase 50 Hz signal on a motor control application.
“The release of J-Scope makes it possible to display and analyze real-time behavior in a unique new way. A number of our clients have asked for this feature. Previously, those who needed to monitor variables have had to rework their application and attempt to use other communication interfaces to transmit this data with varying success. Having HSS available through the debug probe and also open through the J-Link SDK makes monitoring variables a lot easier,” says Alexander Gruener, Product Manager of the SEGGER J-Link family of debug probes.
J-Scope supports all CPUs with some form of background memory read, including most Cortex-M CPUs, and Renesas RX. More information on J-Scope can be found at www.segger.com/j-link-j-scope.html
J-Scope is available free of charge as a part of the J-Link Software and Documentation Pack version 4.90a and later, and can be downloaded at www.segger.com/jlink-software.html
About J-Link
The SEGGER J-Link is the most popular debug probe on the market. It is tool chain independent and works with free GDB-based tool chains such as emIDE and Eclipse, as well as commercial IDEs from: Microchip (MPLAB® X), Atmel, Atollic, Coocox, Cosmic, Freescale, IAR, KEIL, Mentor Graphics, Python, Rowley, Renesas, Tasking and others. With the J-Link family, investments in the debug probe are preserved when changing compiler or even CPU architecture.
J-Link supports multiple CPU families, such as ARM 7, 9, 11, Cortex-M0, M0+, M1, M3, M4, R4, A5, A8, A9 as well as Renesas RX100, RX200, RX610, 620, 62N, 62T, 630, 631, 63N and Microchip PIC32; there is no need to buy a new J-Link or new license when switching to a different yet supported CPU family or tool-chain. SEGGER is also continuously adding support for additional cores, which in most cases, only requires a software/firmware update. Unlimited free updates are included with even the baseline model of the J-Link family. SEGGER is excited to continue advanced development of its cutting edge embedded tool solutions to be utilized with pretty much any development environment you choose. All J-Links are fully compatible to each other, so an upgrade from a lower-end model to a higher-end model is a matter of a simple plug-and-play.
Full product specifications are available at: www.segger.com/jlink.html The J-Link-Software is available at: www.segger.com/download_jlink.html U.S. On-Line Web Shop: http://shop-us.segger.com Online Shop (Europe, Asia, Africa): http://shop.segger.com