Enabling analysis & profiling of embedded system behavior
SystemView is an application (for Windows, macOS or Linux) that analyzes and verifies embedded systems. When using a supported RTOS, no changes are required to target-system hardware or software. For other systems, a small software module included with SystemView (a recorder) is added. SystemView can be used with any embedded system and performs best with streaming data transfer through J-Link, UART, or TCP/IP.
Overview
The SystemView host application enables analysis and profiling of the behavior of an embedded system. It records the monitor data which is generated in the embedded system and visualizes the information in different windows. The recording can be saved to a file for analysis at a later time or for documentation of the system.
The monitor data is recorded via the debug interface, meaning that no additional hardware (especially no extra pins) is required to use SystemView. It can be used on any system that offers debug access.
With a SEGGER J-Link and its Real Time Transfer (RTT) technology, SystemView can continuously record data and analyze and visualize it in real time.
SystemView makes it possible to analyze which interrupts, tasks and software timers have executed, how often, when exactly, and how much time they have used. It sheds light on what exactly happened in which order, which interrupt has triggered which task switch, which interrupt and task have called which API function of the underlying RTOS.
Cycle-accurate profiling can be performed and even user functionality can be timed.
SystemView should be used to verify that the embedded system behaves as expected and can be used to find problems and inefficiencies, such as superfluous and spurious interrupts, and unexpected task changes. It can be used with any (RT)OS which is instrumented to call SystemView event functions, but also in systems without an instrumented RTOS or without any RTOS at all, to analyze interrupt execution and to time user functionality like time-critical subroutines.
How Does It Work?
On the target side a small software module, containing SystemView and RTT, needs to be included.
The SystemView module collects and formats the monitor data and passes it to RTT. The RTT module stores the data in the target buffer, which enables continuous recording with a J-Link on supported systems, as well as single-shot recording on any system.
The target system calls SystemView functions in certain situations, such as interrupt start and interrupt end, to monitor events. SystemView stores these events together with a configurable, high-accuracy timestamp, in the RTT target buffer. Timestamps can be as accurate as 1 CPU cycle, which equates to 5 ns on a 200 MHz CPU.

What Resources are Required on the Target Side?
The combined ROM size of RTT and the SYSVIEW modules is less than 2 KByte. For typical systems, about 600 bytes of RAM are sufficient for continuous recording with J-Link. For system-triggered recording the buffer size is determined by the time to be recorded and the amount of events. No other hardware is required. The CPU needs less than 1 us for typical events (based on 200 MHz Cortex-M4 or Renesas RX CPUs), which results in less than 1% overhead in a system with 10,000 events per second. Since the debug interface (JTAG, SWD, FINE, …) is used to transfer the data, no additional pins are required.
On Which CPUs Can SystemView Be Used?
SystemView can be used on any CPU. Continuous real-time recording can be done on any system supported by J-Link RTT technology. RTT requires the ability to read memory via the debug interface during program execution. This especially includes ARM Cortex-M0, M0+, M1, M3, M4 and M7 processors as well as all Renesas RX devices. On systems which are not supported by the RTT technology the buffer content can be read manually when the system is halted, which enables single-shot recording until the buffer is filled and post-mortem analysis to capture the latest recorded data. Single-shot and post-mortem recording can be triggered by the system to be able to control when a recording starts and stops.
How Much Work is it to Add it to a Target System?
Not very much. A small number of files need to be added to the make file or project. If the operating system supports SystemView, then only one function needs to be called. In a system without RTOS or non-instrumented RTOS, 2 lines of code need to be added to every interrupt function which should be monitored.
That’s all and should take no more than a few minutes.
Modes of Operation
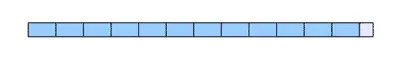
Continuous recording
With a J-Link debug probe and the SEGGER Real Time Transfer technology (RTT), SystemView can continuously record target execution in real time, while the target is running. This enables the analysis of the system behavior over a longer period of time without requiring a large target memory buffer.
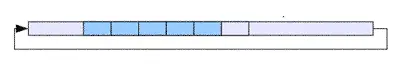
Single-Shot recording
When the target device does not support RTT or when no J-Link is used, SystemView can still record data into its buffer until it is filled. Single-shot recording offers insight to the startup sequence or event-triggered activity in any system for a decent amount of time.
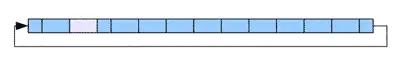
Post-Mortem Mode
Post-mortem analysis is similar to single-shot recording, with one difference: SystemView events are continuously recorded. When the target buffer is filled, older events are overwritten and reading the buffer provides the latest recorded events. Post-mortem analysis can provide information of long-time system tests and help analyzing system crashes.