embOS plugin for Visual Studio Code
The kernel-awareness plug-in for detailed embOS insights.
Thread-aware debugging
When halting a target system in the debugger, the current registers (program counter, stack pointer, etc.) and the current call stack are shown by default. When running embOS, the system will spend most of its time in the idle task. This means that when halting the system, there is a good chance that it will be in idle, and little information is gained via the current registers and call stack.
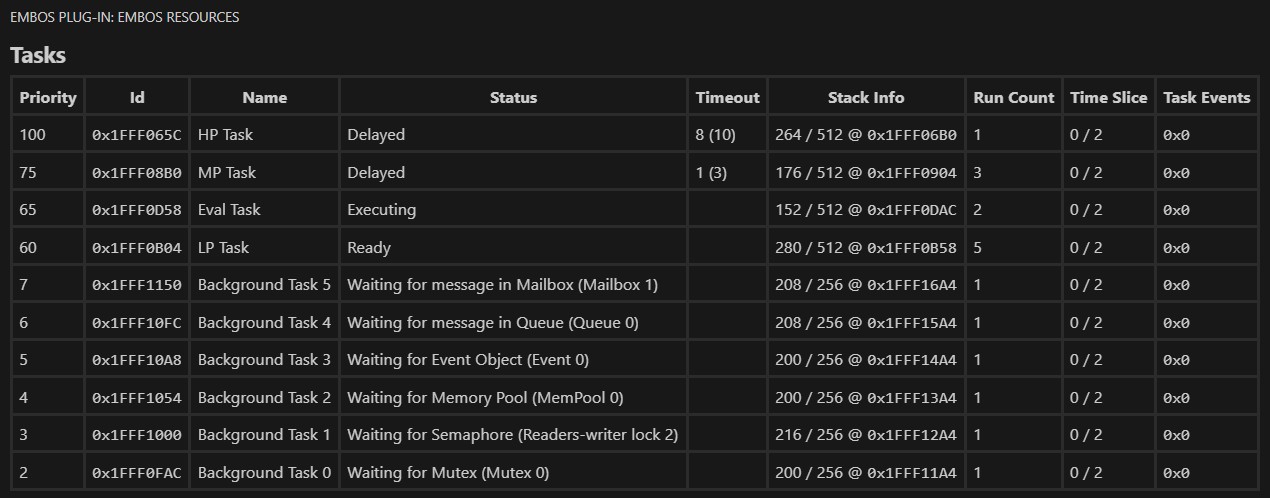
Thread-aware debugging refers to a debugger's ability to show all existing embOS tasks that are running on an embedded system when the target system is halted by the debugger.
SEGGER's embOS plug-in for Visual Studio Code gives embOS awareness during debugging sessions. This enables a user to inspect the state of multiple embOS primitives, such as tasks and embOS objects created. Moreover, the embOS plug-in allows monitoring of both active and inactive tasks.
The embOS plugin for Visual Studio Code is available at the Visual Studio Marketplace.
Task sensitivity
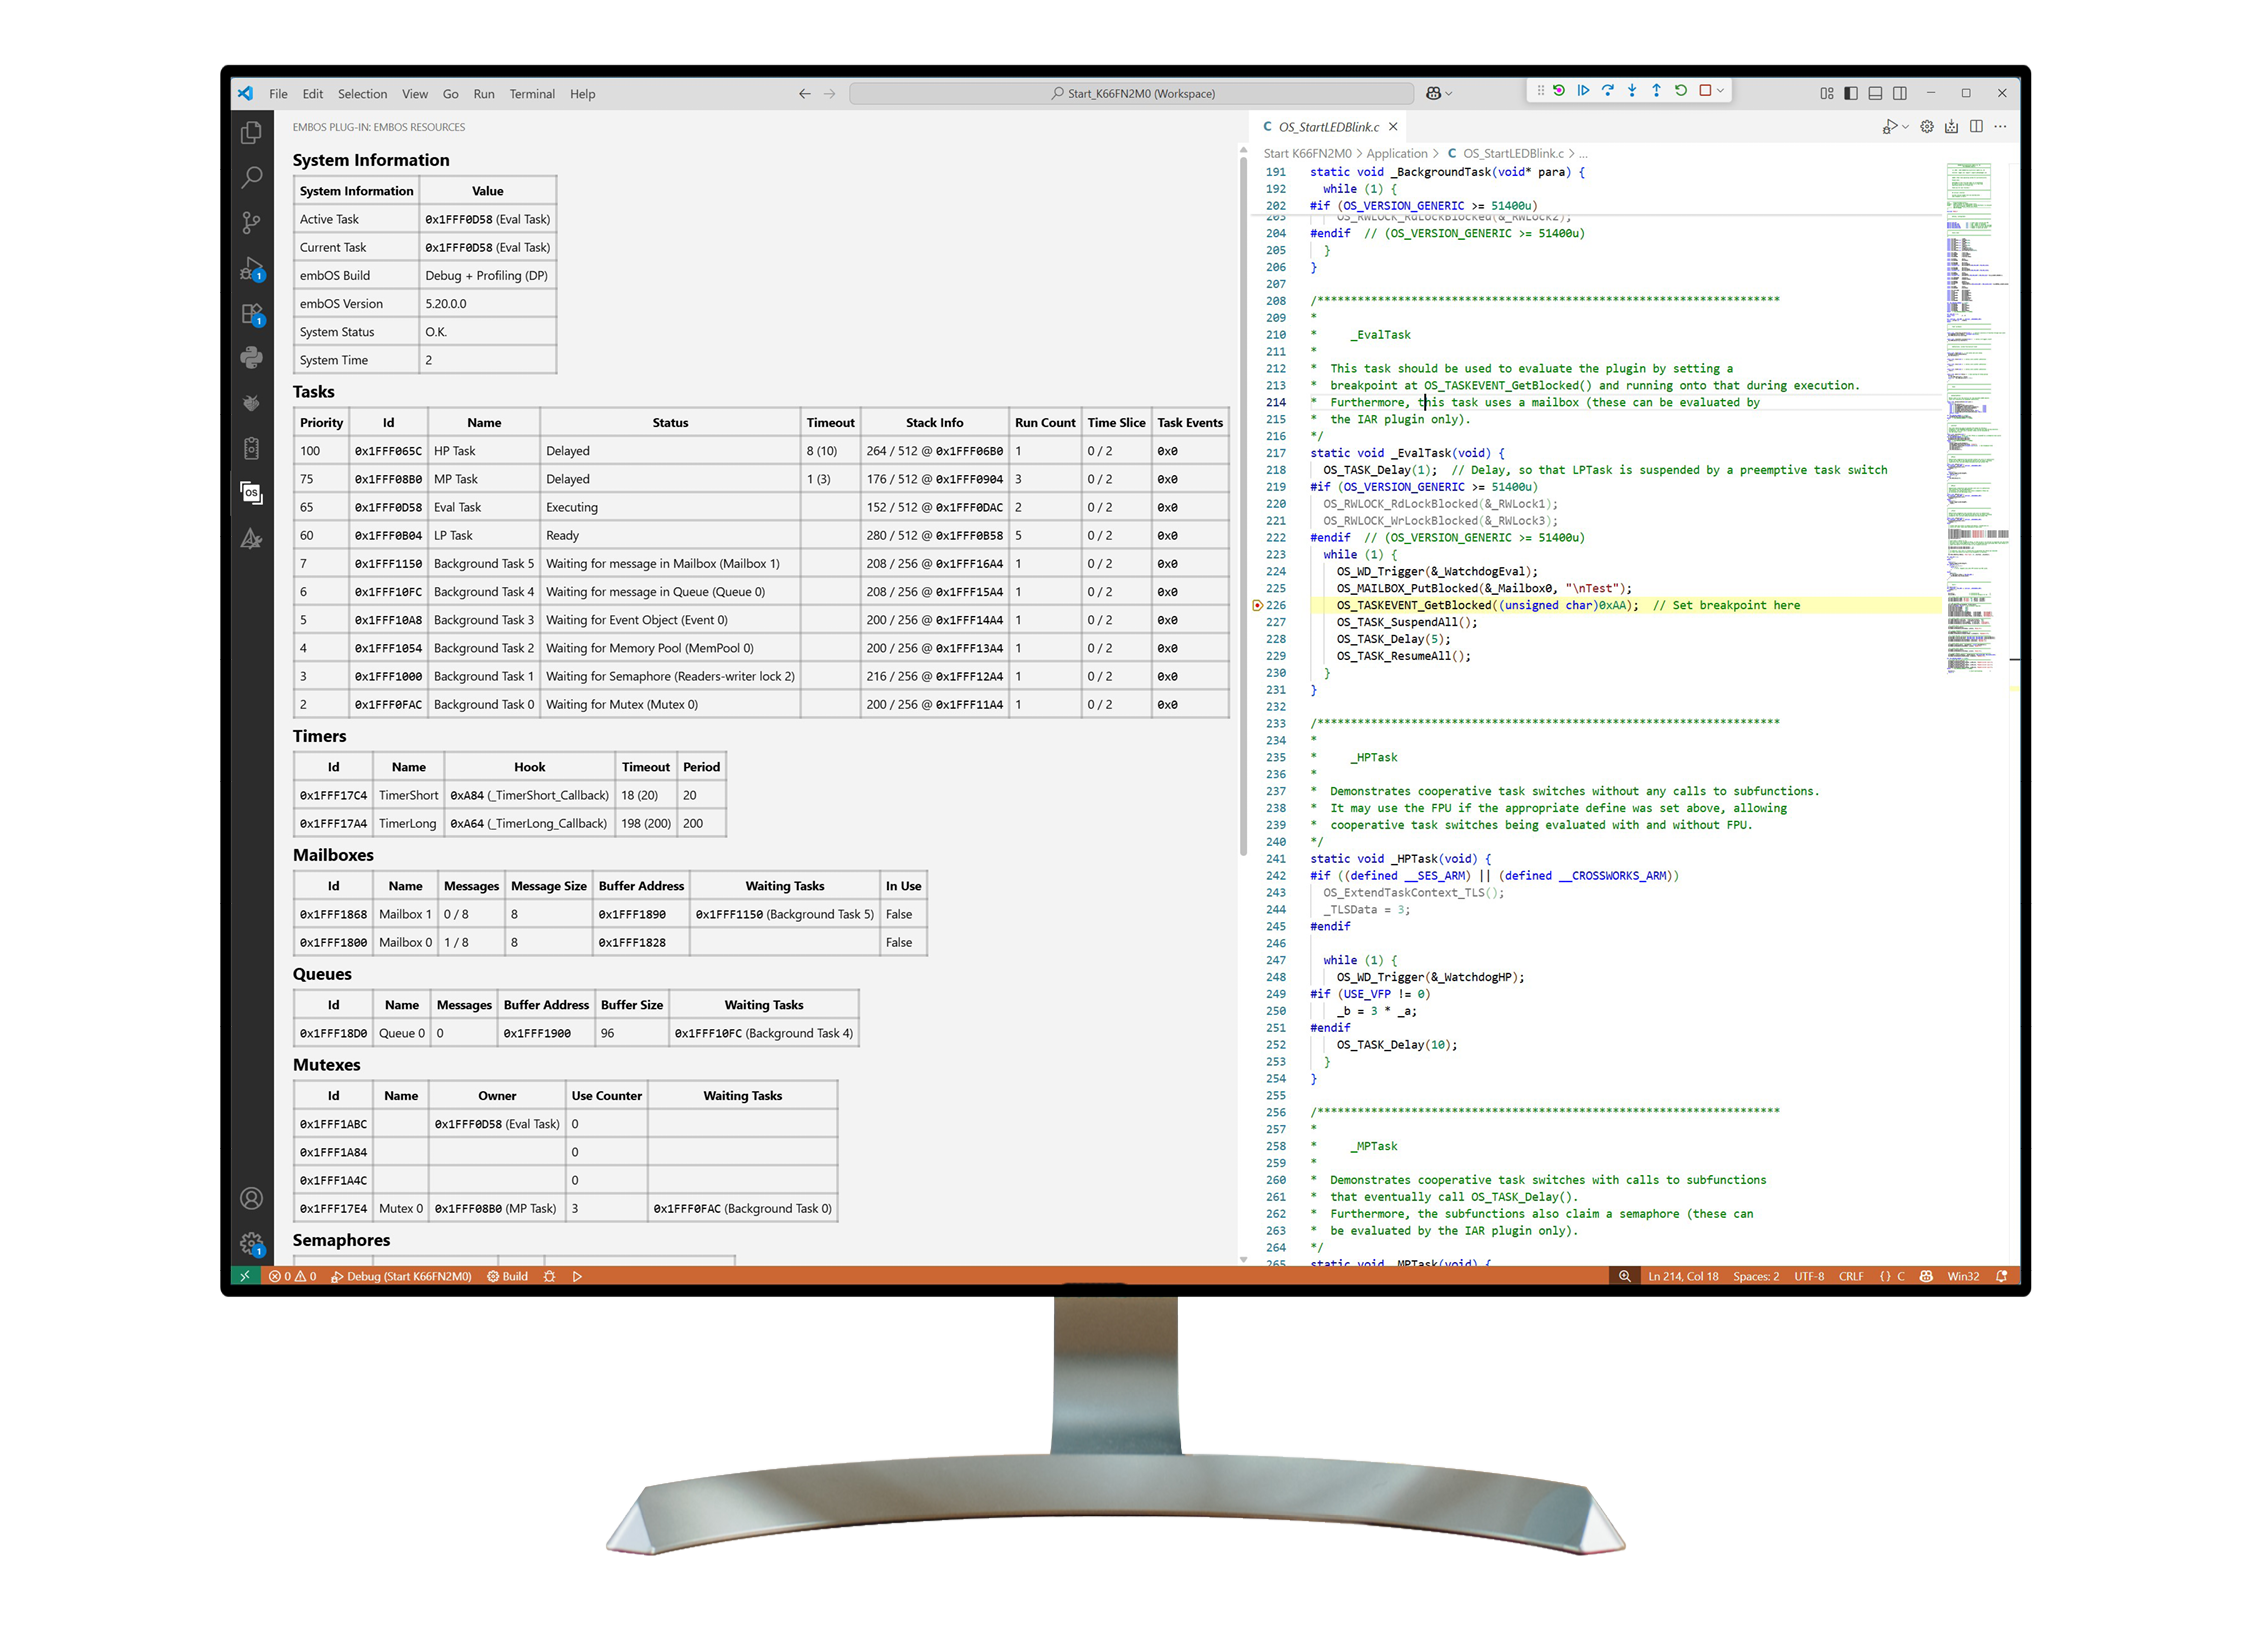
Although Visual Studio Code’s interface is not task sensitive, developers can use the Ozone standalone debugger to access this feature. With Ozone's interface, developers benefit from task sensitivity. The Source Code, Disassembly, Registers, and Call Stack windows are task sensitive, meaning Ozone can show general-purpose-register content, as well as the call stack for the task related to the current position in code.
By default, and typical of a debugger, the selected task is the running task. Users may, however, examine any task they choose by double-clicking on the corresponding row in the plug-in window. The selected task will then be highlighted, and the call stack and preserved general-purpose registers of the suspended task will be rebuilt. More information on task sensitivity is available on the Ozone page.
embOS object lists
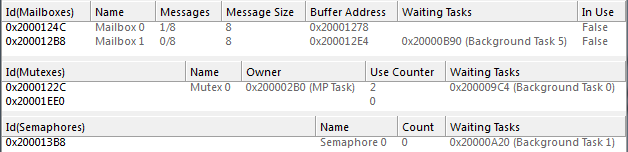
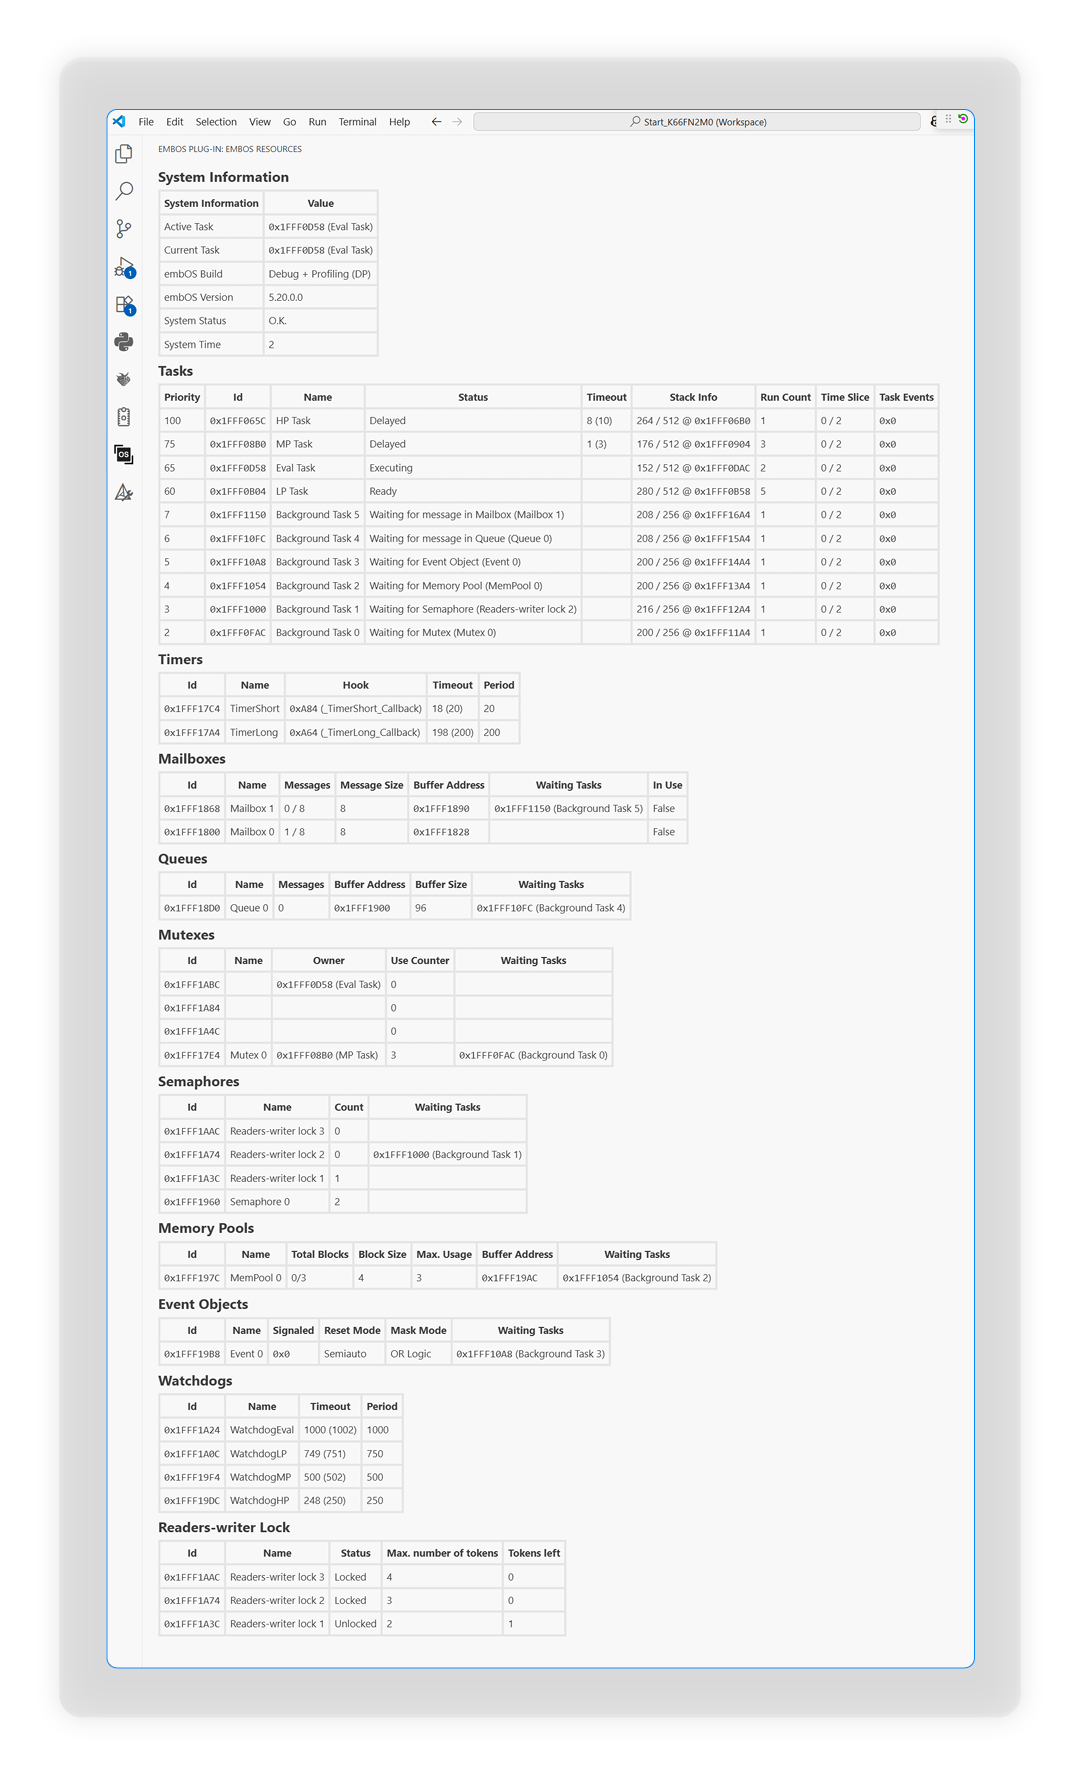
In addition to a task list, the plug-in provides lists for all embOS objects if Visual Studio Code version 1.103 or greater is used. These lists show information specific to embOS objects, and they can be activated individually. The information displayed includes event objects, mailboxes, memory pools, mutexes, queues, semaphores, timers, and watchdogs.
Get in touch with us
Have questions or need assistance? Our Embedded Experts are here to help!
Reach out to us for:
- Licensing quotes
- Technical inquiries
- Project support