Trace reports
Ozone trace reports export execution data from instruction tracing for external analysis & documentation.
After running a test application and collecting trace data, further analysis of the information might need to be done. Data may also have to be stored for QA processes or certification. Ozone lets you save debug snapshots for later analysis within the tool. This allows you to export trace information for use in external tools.
Understanding Instruction Trace Export
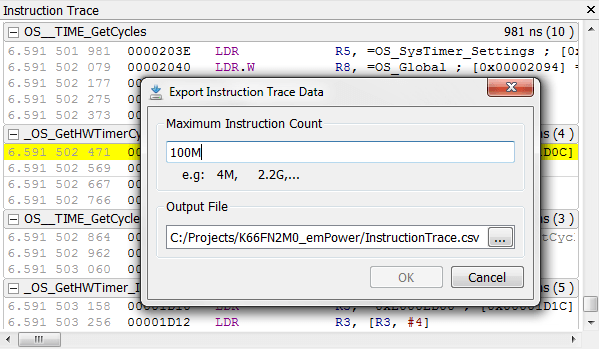
All information from the Instruction Trace Window can be exported into a CSV file. The export file contains all instructions as shown in Ozone. This includes address, encoding, corresponding source line, and execution timestamp. This information can be used with external scripts and tools to further analyze what recently happened on the target system.
Using Ozone's instruction trace export does not require a complex parser for the hardware-dependent trace data. All information is readily available in a generic format.
Code Coverage and Profiling Reports
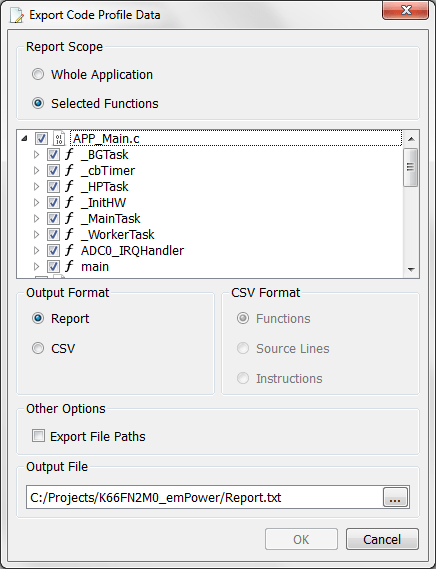
After a test application is run, Ozone immediately provides information for code coverage and profiling. The information from the Code Profiling Window can be exported for further analysis in external tools, or as human-readable text files to be stored for QA processes or certification.
For further analysis, the code coverage and profiling data can be saved as a processable CSV file. All information as shown in the window is available. The export can be further refined to select the whole application or only modules and functions of interest to be stored.
For documentation purposes, the data can be saved as a text file. This resembles the code coverage and profiling information in an easily readable and understandable form. As with the CSV export, the range to be exported can be selected.
Ozone Code Profile Report

Project:       C:/Projects/K66FN2M0_emPower/Start_K66FN2M0.jdebug
Application:   C:/Projects/K66FN2M0_emPower/Output/Start_K66FN2M0.elf

Code Coverage Summary

Module/Function      |      Source Lines       |      Instructions
---------------------+-------------------------+------------------------
APP_Main.c           |                         |
  _BGTask            |    5 /     6     83.3%  |   12 /   13     92.3%
  _cbTimer           |    5 /     6     83.3%  |   17 /   18     94.4%
  _HPTask            |   14 /    14    100.0%  |   57 /   57    100.0%
  _InitHW            |    7 /     8     87.5%  |   29 /   30     96.7%
  _MainTask          |   15 /    15    100.0%  |   83 /   83    100.0%
  _WorkerTask        |    7 /     8     87.5%  |   28 /   31     90.3%
  ADC0_IRQHandler    |    6 /     7     85.7%  |   50 /   56     89.3%
  main               |   11 /    13     84.6%  |   60 /   64     93.8%
---------------------+-------------------------+------------------------
  Total              |   70 /    77     90.9%  |  336 /  352     95.5%


Code Profile Summary

Module/Function      | Run Count | Fetch Count
---------------------+-----------+-------------
APP_Main.c           |           |
  _BGTask            |        1  |     13 022
  _cbTimer           |      291  |      4 947
  _HPTask            |        1  |     12 339
  _InitHW            |        1  |         29
  _MainTask          |        1  |     51 863
  _WorkerTask        |      646  |    766 016
  ADC0_IRQHandler    |      291  |     14 841
  main               |        1  |         60
---------------------+-----------+-------------
  Total              |    1 233  |    863 117
Automated Testing
Ozone supports fully automated runs of a test application from the start of a debug session to the export of the report file.
An Ozone project file is a C programming language-like script. It enables full control over the debugging workflow. When a new project is created, the main routine OnProjectLoad(), does the basic setup for connection, target device, and target application. The scripting interface offers most actions that are accessible via the graphical user interface as affiliated functions. Additionally, callbacks in the project file are called at certain points: debug start, reset and download, target halt or a breakpoint.
With these functions and callbacks an automated test can be created:
- Setup the connection to J-Trace and target device
- Configure and enable instruction trace
- Load the test application to the target
- Send test parameters to the target
- Set a breakpoint at the end of the test application
- Run the test on the target
- When the breakpoint is hit, export the instruction trace data and code coverage report
- Exit Ozone
For more information refer to Automated Tests with Ozone