Code coverage
Measure the code coverage of embedded applications on actual hardware.
Ozone’s trace capability can provide accurate information about instruction execution on the target system. This allows a full code coverage analysis of the firmware on the actual hardware. With the J-Trace streaming trace support, code coverage information is generated live and updated while the target is running.
Ozone analyzes and visualizes code coverage while the target system executes.
What is Code Coverage?
Code coverage metrics are a way to describe the "quality" of code, as "only tested code is finished code". A code coverage analyzer measures the execution of code and shows how much of a source line, block, function or file has been executed. This information makes it possible to detect code which has not been covered by tests, or may even be unreachable. This in turn enables a fast and efficient way to improve the code or to create a suitable test suite for uncovered blocks.
Code Coverage on Embedded Systems
Code coverage tests should be run on actual hardware. When interfacing with external interfaces, such as USB and Ethernet, or using closed loop or feedback control, it is nearly impossible for simulation environments to replicate the correct timing or other characteristics of the real hardware that might affect program execution. Only actual hardware testing can yield true results.
Running code coverage on actual hardware requires tracking code execution on the target. This can be accomplished either intrusively, by instrumentation, or non-intrusively, by tracing the program counter in real-time.
Code instrumentation might not work with hard real-time requirements. The delays introduced by instrumentation affect timings and can destabilize closed loop controllers. For such systems, it is important to use non-intrusive methods for code coverage analysis.
With Ozone and J-Trace PRO, code coverage analysis is completely non-intrusive. It does not require modified code or alter the execution. With the streaming trace capability, a whole test suite can be run in one go without having to halt or reload the test application.
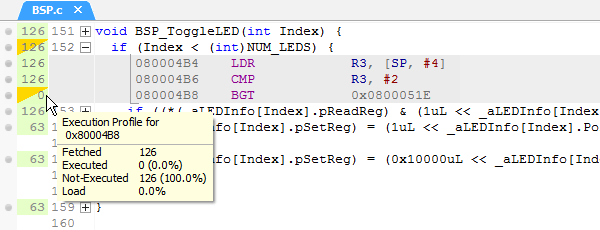
Ozone highlights partially covered (orange) and fully covered (green) source lines.
Expanding a source line reveals the coverage of corresponding instructions.
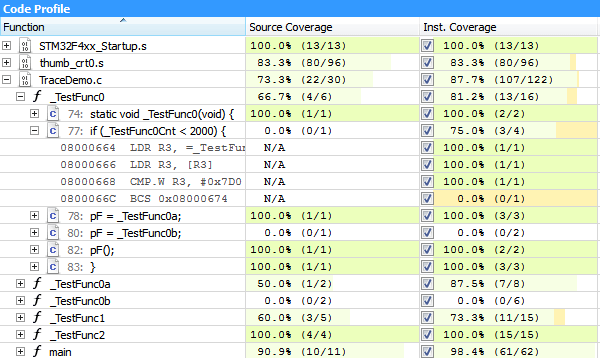
The Code Profile Window displays the source coverage and instruction coverage.
The hierarchical view reveals the coverage on any level: File, function, source line, and instruction.
Running Code Coverage Tests
Code coverage analysis is usually done with a test application, which triggers different routines of the actual firmware code. These routines run as they would in the final system based on the given parameters. The generated instruction trace data is recorded and analyzed as the test runs.
Ozone takes the analyzed information and displays exactly which instructions or lines of code have been executed by running the test. In Ozone, this is done by highlighting executed lines in the source code viewer.
The code coverage information does not only show which lines have been fully executed, i.e. all instructions of a line are executed, but it can also show where conditions have not yet been fully met, i.e. have not been true and false. Highlighting source lines provides a quick overview of which code has been recovered. Uncovered source lines or blocks might then require additional test parameters to be tested, improved upon, fixed, or rewritten.
Code Coverage Reports
After running a code coverage test, the collected information should be stored for further analysis or documentation.