Code analysis
Analyze code and resource usage before debugging
- Analyze memory and stack usage
- Identify potential issues with static code analysis
- Explore code structure and symbols
Overview
Embedded Studio provides a range of tools for analyzing applications before debugging. Developers can examine memory and stack usage, explore code structures and symbols, and identify potential issues through static code analysis.
These tools provide insight into the compiled application, helping developers understand resource requirements, navigate complex projects, and detect potential problems early in the development process.
Memory Usage
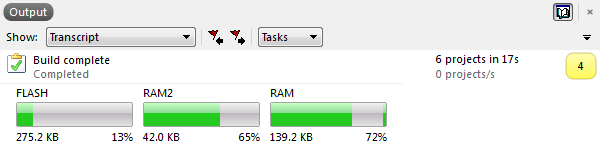
After a successful build, the log window displays the application's memory usage, providing an immediate overview of how much flash and RAM it occupies.
For a more detailed analysis, the Memory Usage window shows how code and data sections are distributed across the available memory regions. Memory types and sizes are determined by the target device and project settings. The window displays all configured memory regions, including internal flash, RAM, and external memory.
Code Outline
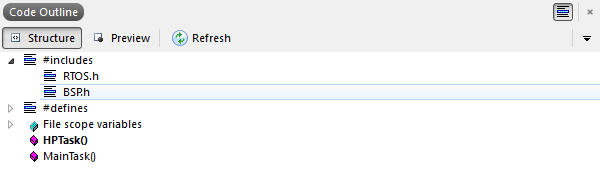
Navigating large source files can be challenging, especially when searching for specific functions or symbols. The Code Outline window provides a structured overview of the source code, making it easier to locate and navigate between elements.
Includes and defines can be grouped, while complex elements can be expanded to display their members. A single click takes you directly to the selected element in the source code.
Source Navigator
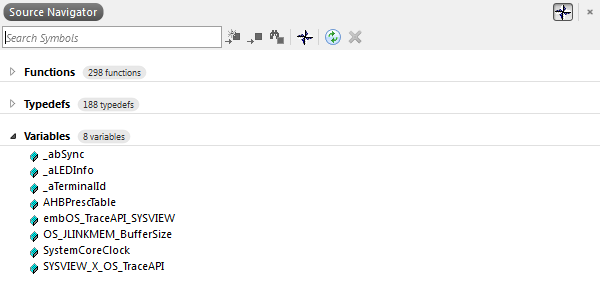
Even in well-structured projects, locating specific functions or symbols can be challenging. The Source Navigator provides quick access to functions, typedefs, and variables, allowing developers to jump directly to their definitions with a single click.
For even faster navigation, the Find Symbol (Alt+Y) and Find Method (Ctrl+M) commands provide quick access to specific code elements.
Symbol Browser
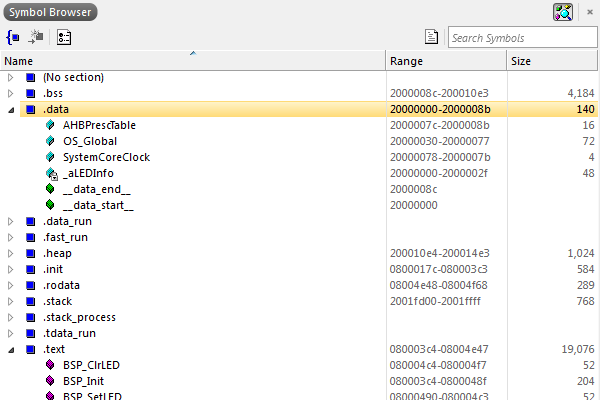
The Symbol Browser provides detailed insight into the compiled application, showing the memory usage and location of individual symbols on the target device. Symbols can be grouped by source file, section, or type, making it easier to analyze memory allocation and identify resource-intensive components.
Stack Usage
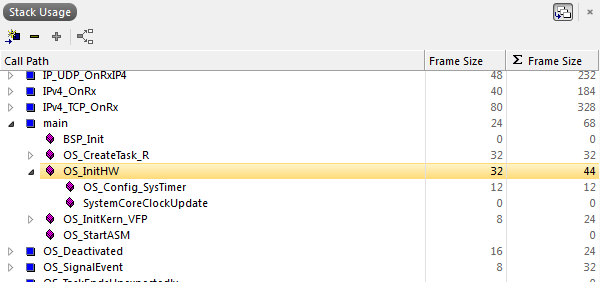
Determining how much stack memory an application or individual task requires can be challenging. The Stack Usage window performs static stack analysis to estimate stack requirements for individual functions and call paths, helping developers identify potential stack usage issues.
Static Code Analysis
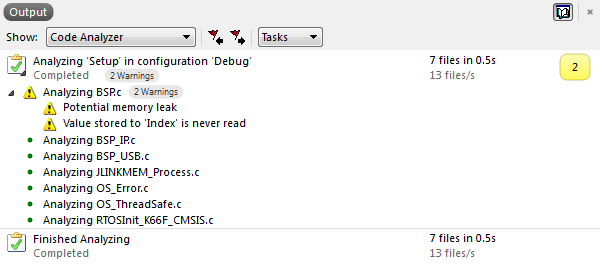
Compilers can detect potential issues, such as uninitialized variables, and report them as warnings. Static code analysis goes a step further by identifying additional issues that may affect code quality, reliability, or performance.
Analysis results are displayed in the log window, allowing developers to navigate directly to the relevant source code.
Find out more about the static code analyzer on our Wiki page.
External Analysis Tools
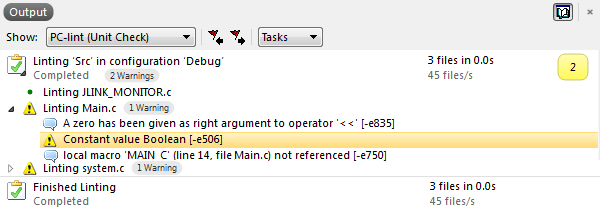
Embedded Studio supports the integration of external tools for additional code analysis, such as checking source code for compliance with MISRA guidelines. Developers can configure custom commands and execute them on individual project items.
Tool output is displayed in the log window. For supported tools, such as Lint, developers can navigate directly to the source lines associated with reported issues.