Fault analysis
Where – and why- did the system crash? Automatically detect exceptions and find useful information regarding the crash. Analyze each fault with these debugging features.
Firmware crashes – they’re a fact of embedded application development. Illegal memory writes, access of unpowered peripherals, execution of invalid instructions, division by zero… Whatever the execution, it ends up in an exception handler.
So, what to do?
Ozone enables automatic fault detection, but it does more than that. There are further tools and information for analysis of why a crash happened, what could have caused it and what happened before.
Exception Detection & Vector Catches
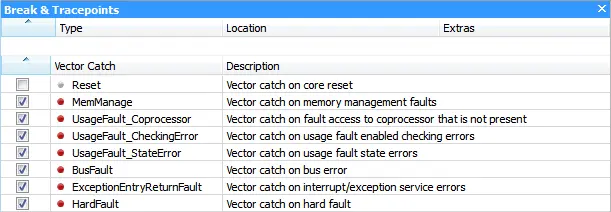
Ozone makes use of the Vector Catches on Arm devices.
ARM devices can break execution on fetch of an exception vector just before the exception handler is executed. This feature enables automatic breaking on exception without the use of hardware breakpoints.
With a vector catch on HardFault, a system crash can be immediately detected and further analyzed in the debugger.
In Ozone, vector catches can be enabled or disabled in the Breakpoints Window.
Exception Reasons: No Need for Manual Gathering
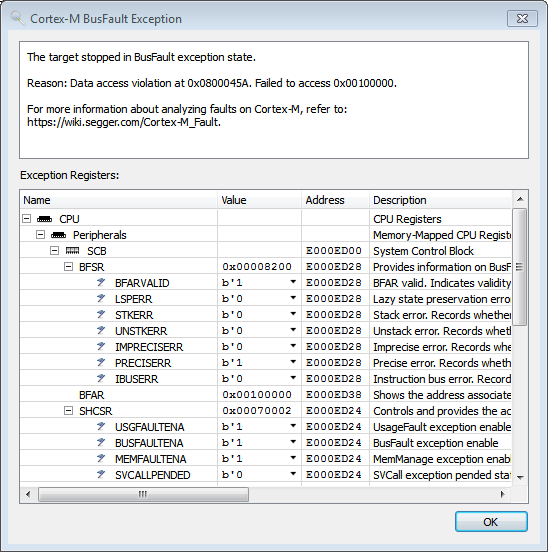
When a system crashes, Arm Cortex-M microcontrollers will provide information about the crash in different registers. After all, gathering information manually to find the reason for a crash is cumbersome.
When Ozone detects a fault, it automatically analyzes the related registers and presents a popup with the reason for the crash and further information, such as where the crash happened or which address could not be accessed.
For more information on faults on Cortex-M, refer to: Cortex-M Faults.
Exception Analysis with Regular Debug Information Windows
Now you’ve found the reason for the crash, it’s time to identify where it happened.
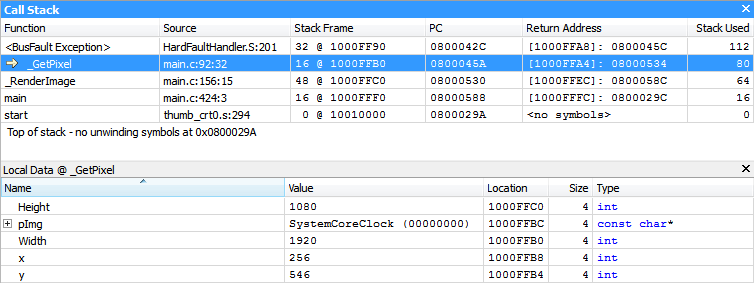
Ozone provides regular debug information in addition to the fault status registers. Even in the case of an exception. On the Call Stack Window, you can see where the exception has been raised. With the Registers Window and the Locals Window, you can inspect the faulty state.
Some exceptions might be raised after the actual fault happened, usually a few instructions later. In these cases, Ozone's instruction trace can help to identify which instructions have been executed before.
For technical details on fault analysis with Ozone, refer to: Analyzing Cortex-M Faults with Ozone.