SEGGER News
Welcome to the News section, your hub for the latest updates and insights from SEGGER.
2021
|
Jan. 21
- Ozone
- J-Link
- J-Trace
- News
Author:
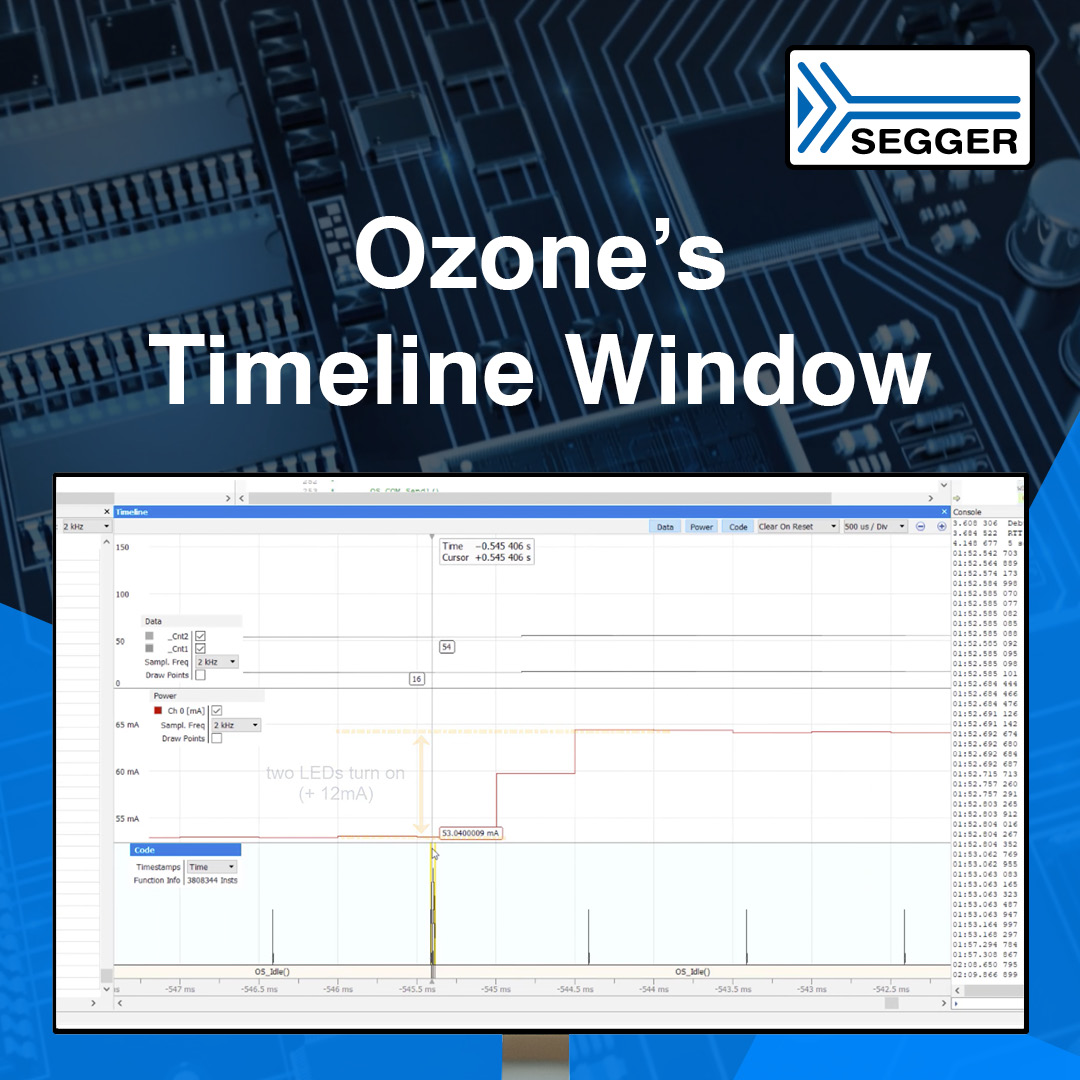
Correlating and visualizing data sampling, current consumption, and program execution via Ozone’s Timeline Window
Read the complete article on our blog: https://blog.segger.com/correlating-and-visualizing-data-sampling-current-consumption-and-program-execution-via-ozones-timeline-window/
You want to see the Ozone Timeline Window in action? Watch the demo here.
Watch the Ozone Timeline Window demo on YouTube: https://www.youtube.com/watch?v=Iu9XpFNgU7Q
